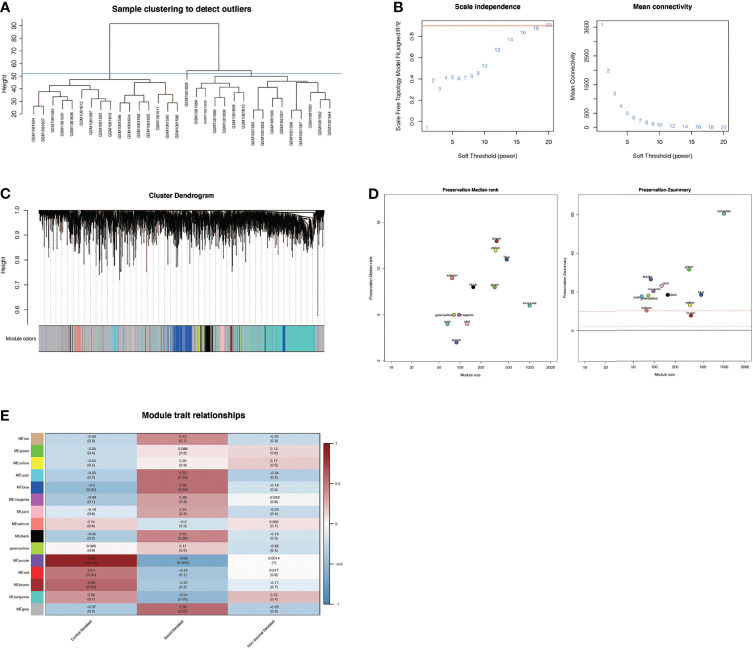
Figure 5.
Weighted co-expression network analysis in GSE44270. (A) Sample clustering of dataset GSE44270. The samples were clustered into two significantly different clusters. The cluster on the left is selected for subsequent analysis. (B) Selection of optimal thresholds. The threshold is 18. (C) By aggregating genes with strong correlations into the same module, different modules are obtained and displayed in different colors. Turquoise modules account for a larger proportion. (D) Verification of the accuracy of WGCNA results. (E) Correlation analysis between modules and keloid. Purple module was significantly positively correlated with normal skin fibroblasts (NF) (COR= 0.86,P <0.001) and negatively correlated with keloid fibroblasts (KF) (COR = -0.68,P <0.01). The genes in the purple module were labeled as the WGCNA-hub genes.

