Figure 6.
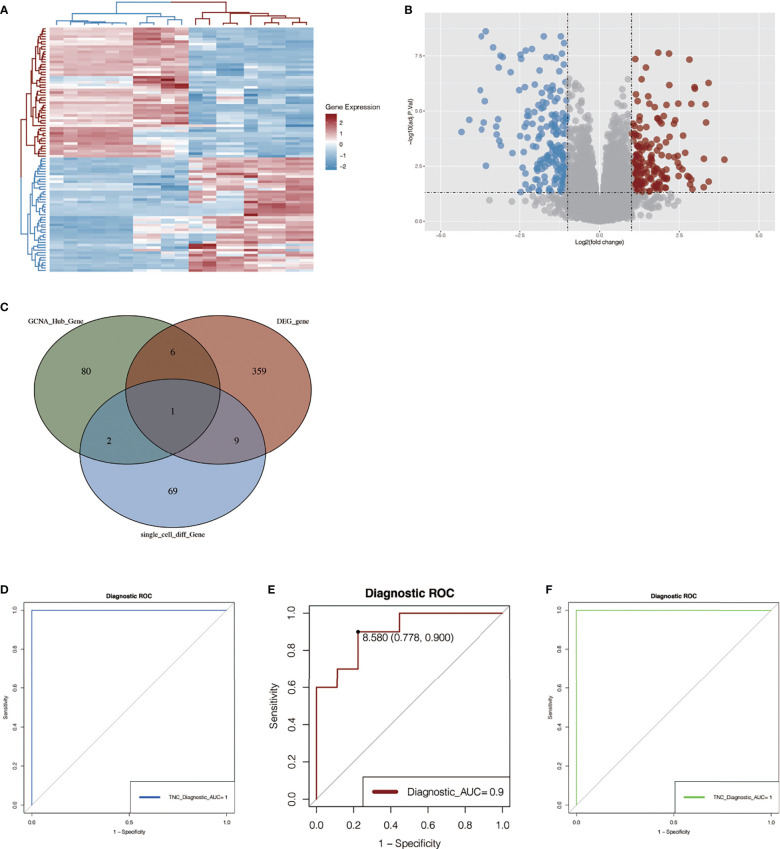
Differential gene analysis in GSE145275 and venn map intersection to obtain the key gene: TNC. (A) Heat maps of difference analysis results. The darker the red, the higher the expression level, and the darker the blue, the lower the expression level. (B) Volcanic maps of differential genes. Blue represents genes that are low-expressed in keloid tissue and red represents genes that are high-expressed in keloid tissue. (C) The intersection of single cell analysis, WGCNA and differential expression analysis was displayed in Venn diagram. The most significant gene, TNC, was obtained. (D, E) ROC curve construction in public data sets to evaluate the diagnostic accuracy of TNC of keloid. The AUC of dataset GSE145725 was 1.0 (D). The AUC of ROC curve of dataset GSE44270 was 0.9 (E). (F) RNA-sequencing data of our center were used to construct ROC curve to verify the accuracy of TNC. The AUC of the area under the curve is 1.

