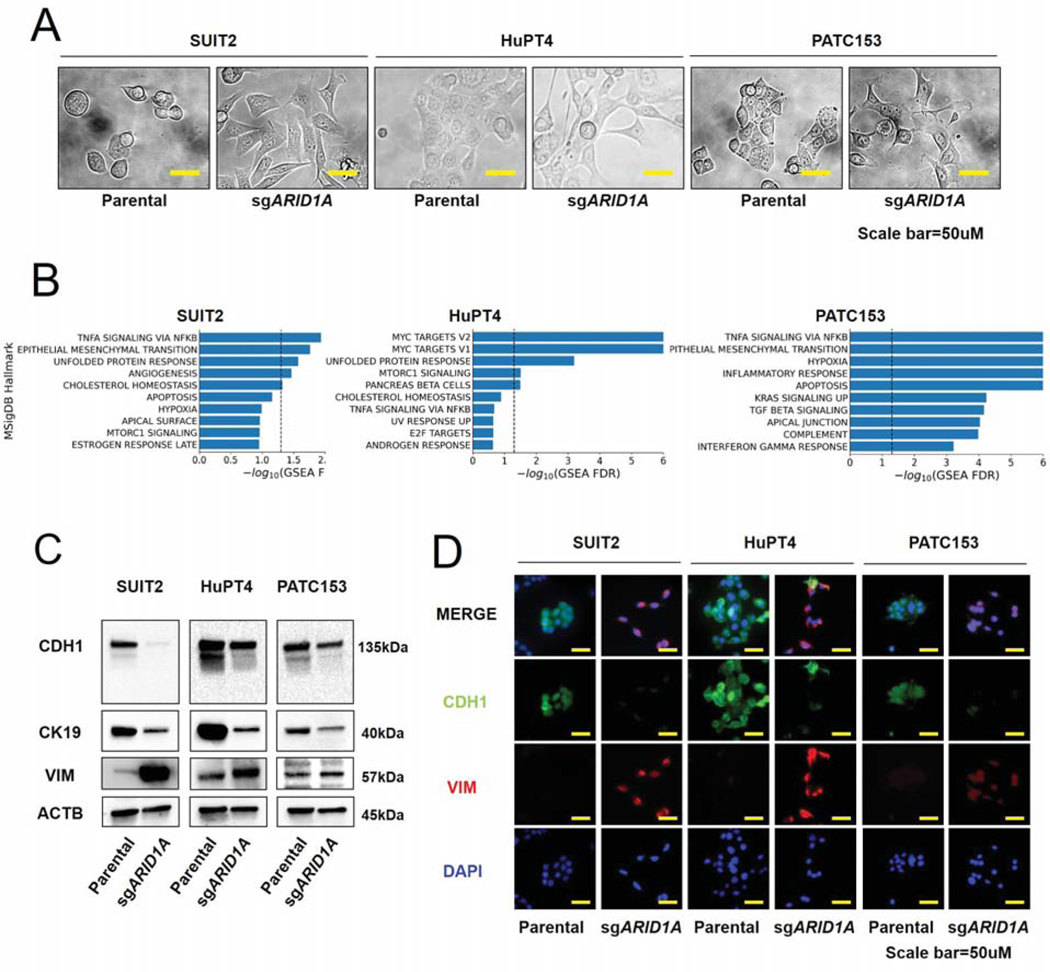
Figure 3. Epithelial-mesenchymal transition is upregulated in ARID1A-ablated PDAC cell lines.
A. Morphologies of parental cells and ARID1A knock-out cells. Scale bars, 50 um. B. Top 10 positively enriched MSigDB Hallmark gene sets via GSEA for differential expression profiles of each ARID1A knock-out cell line compared to isogenic parental cells. Dotted line represent -log10(FDR<0.05). C. Immunoblotting analysis of E-CADHERIN (CDH1), cytokeratin 19 (CK19), VIMENTIN (VIM), and β-ACTIN (ACTB) in parental cells and ARID1A knock-out cells. D. Co-immunofluorescence staining for E-CADHERIN, VIMENTIN, and DAPI. Scale bars, 50 um.

