FIGURE 1.

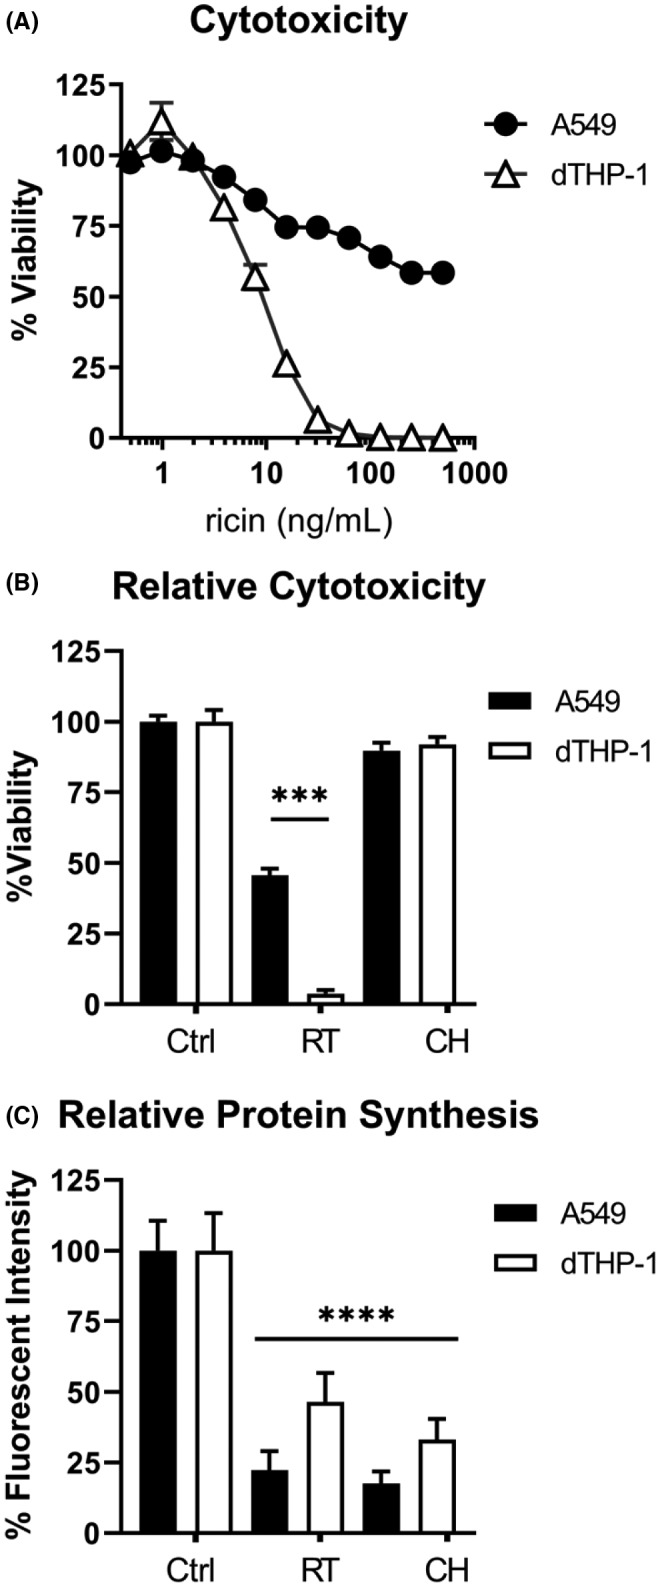
Comparative sensitivity of A549 and dTHP‐1 cells to ricin toxin. (A) Side‐by‐side 96‐well plate cytotoxicity assays were used to compare ricin sensitivity across a range of doses between A549 and dTHP‐1 cells. Cells were exposed to ricin for 4 h, washed, and allowed to recover for 24 h prior to assay development. Data presented are the mean of eight replicate wells with the 95% confidence interval. Viability as expressed by AUC ±95% CI (area under the curve with 95% confidence interval) was significantly different, with a value of 1428 ±93 for THP‐1 cells and 31210 ±1100 for A549 cells. (B) Cytotoxicity and (C) protein synthesis inhibition were compared side‐by‐side in both cell types following 4 h exposure to 20 ng/ml ricin (RT) or 50 µg/ml cycloheximide (CH). Circles represent A549 cells, triangles represent dTHP‐1 cells. In panel (B), viability was significantly reduced in both cell types following ricin treatment (p < 0.0001). When comparing ricin‐treated dTHP‐1 and A549 cells, dTHP‐1 cells exhibited a significantly greater reduction in viability (p < 0.0001). In panel (C), both RT and CH treatment significantly reduced protein synthesis compared to the untreated controls (p < 0.0001). Within each cell type, RT and CH treatment were equally effective at inhibiting protein synthesis. Although ricin treatment had a significantly greater suppressive effect on protein synthesis in A549 cells (p = 0.0065), its lethality was significantly lower in this cell type. (a) N = 7–8, (b) N = 14–16, (c) N = 8–10. The significance of “*** and ****” correspond to <0.001 and <0.0001, respectively
