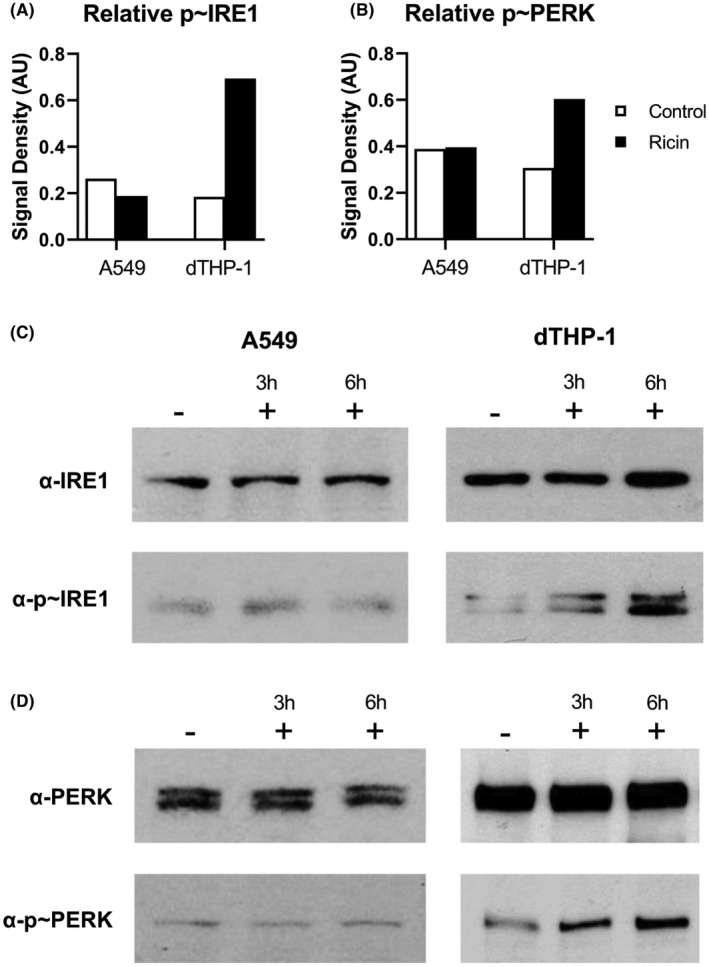
FIGURE 3.

Evidence for ER stress in dTHP‐1 but not A549 cells. The relative abundance of phosphorylated IRE1 (A, C) and phosphorylated PERK (B, D) in response to 6 h ricin treatment (black bars; 20 ng/ml) or controls (white bars) in dTHP‐1 cells. Bars represent the semi‐quantitative signal density of the phosphorylated form of each protein relative to the total pool of that protein probed sequentially on the same membrane swatch. Digitized films of representative western blots selected from among three to four replicate experiments. Membrane swatches were probed with anti‐phospho‐PERK (Cell Signaling Technology Cat# 3179, RRID:AB_2095853) or anti‐IRE1 (Cell Signaling Technology Cat# 3294, RRID:AB_823545), then stripped and re‐probed with anti‐PERK (Cell Signaling Technology Cat# 3192, RRID:AB_2095847) or anti‐phospho‐IRE (Thermo Fisher Scientific Cat# PA1‐16927, RRID:AB_2262241) antibodies. Results at 3 h treatments were variable and thus were not included in the semi‐quantitative graphs in (A) and (B). Refer to Figures S3–S6 to observe the original films from which these images were derived
