FIGURE 6.

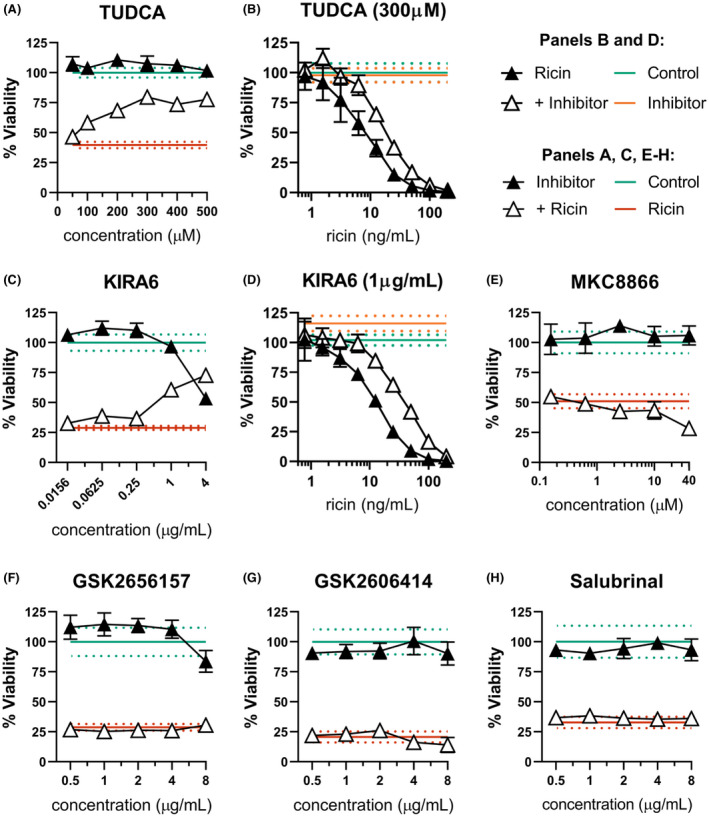
ER stress contributes to dTHP‐1 ricin sensitivity through IRE1 activity. dTHP‐1 cells were pre‐treated with the indicated ERS suppressing compound for 18 h prior to 2 h co‐treatment with ricin (A & C, 10 ng/ml; E–H,12.5 ng/ml). (A) Pre‐treatment with TUDCA was able to partially rescue ricin sensitivity in dTHP‐1 cells. Rescue was statistically significant from 200 µM (p ≤ 0.03). (B) Pre‐treatment with 300 µM TUDCA significantly reduced cytotoxicity of ricin exposure (AUC 3302 ±207 vs. 1604 ±174 of ricin‐only). (C) Specific inhibition of IRE1 with the small molecule KIRA6 partially rescued ricin‐induced dTHP‐1 cell death, with significant independent toxicity at doses exceeding 1 μg/ml. Rescue was statistically significant in all but the lowest doses (p < 0.0001). (D) Pre‐treatment with 1 µg/ml KIRA6 significantly reduced cytotoxicity of ricin exposure (AUC of 5879 ±386 vs. 2165 ±142 of ricin‐only) (E) Pre‐treatment with IRE1 RNase inhibitor MKC8866 enhanced ricin toxicity at 40 µM (p < 0.001) with no effect seen at lower doses. (F and G) Specific inhibition of PERK using the small molecule inhibitors GSK2656157 and GSK2606414 had no effect on ricin‐induced cell death. GSK2656157 exhibited significant independent toxicity above 8 μg/ml, while GSK2606414 was well tolerated. (H) Treatment with Salubrinal had no independent toxicity and no effect on ricin‐induced cell death. Green lines and dots and red lines and dots represent the mean and 95% CI of control‐ and ricin‐treated cells, respectively, while orange lines and dots similarly represent the independent effect of KIRA6 or TUDCA. Closed symbols, ricin‐only; open symbols, dual treatment; error bars represent the 95% CI. Data presented are the mean of at least six replicate wells. For (A), (C), and (E, F), points in the dual‐treatment group have been individually corrected for significant independent effects on viability by the inhibitor treatment as appropriate. Graphical representation of the unnormalized data (panels B, C, and D) and results of pairwise statistical testing for treatment interactions (panels B and D) are available in Figure S9
