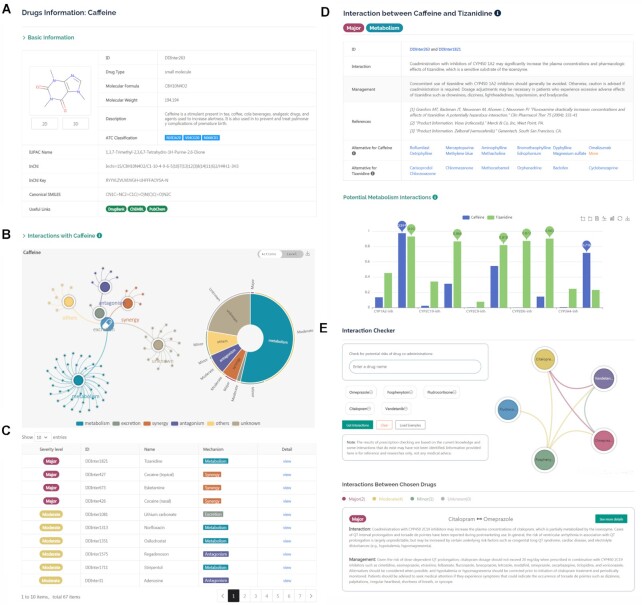
Figure 2.
The web interface of DDInter. (A) Basic chemical and pharmacological information of the queried drug (caffeine, DDInter263). (B) Visualization of DDI network. The relation graph displays the distributions of all the involved DDIs and the sunburst chart shows different hierarchies of DDI associations. (C) A list of drugs interacting with the query drug. (D) The page of specific drug–drug pair shows extensive information of interactions. (E) The interaction checker module helps physicians screen for risks in prescriptions.

