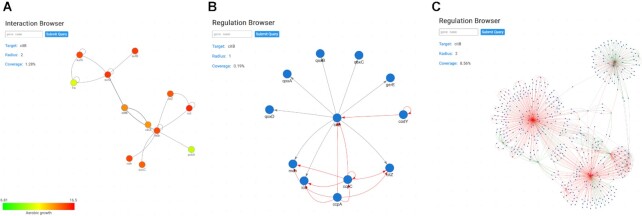
Figure 3.
The Interaction and Regulation Browsers. (A) Interaction Browser for the citB gene. Nodes represent proteins and edges represent physical interactions, commonly referred to as protein–protein interactions. Using the settings, transcriptomic and proteomic data can be integrated using a color code (this feature is also available for the Regulation Browser). Upon selection of an experimental condition to be visualized, each node will be masked with a color depending on the expression value of the gene in the selected dataset. Green represents lower values of expression and red represents higher values of expression. (B) Regulation Browser for the citB gene. Nodes represent genes and edges represent regulatory interactions. The interaction type is represented with a color scheme: red for repression, green for activation and gray for sigma factor. (C) Regulation Browser for the citB gene with an increased radius of distance of 2. This setting allows to expand all regulations from the initial representation (B) with the distance of 2 elements [thus including the regulatory interactions of the primary partners that are shown in panel (B)], creating a more complex view over the regulatory network of citB.

