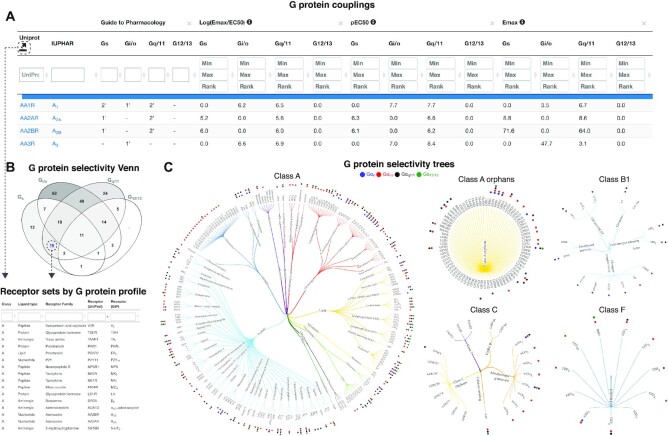
Figure 1.
G protein couplings and selectivity. (A) G protein couplings encompass Guide to Pharmacology (GtP) primary/secondary transducers (22) and log(Emax/EC50), pEC50 and Emax values from profiling studies (3–5) and a means thereof. The confidence and coverage of quantitative couplings can be adjusted based on counts of supporting datasets (default 2) and standard deviations from basal signal (default 1.4). (B) G protein selectivity profiles can be intersected in a Venn diagram counting the receptors in each class. (C), G protein selectivity trees map couplings to trees classifying receptors by class, ligand type and receptor families sharing endogenous ligand(s). (B, C) Dashed arrows illustrate paths to obtain coupling-based selection of receptor sets for further study.

