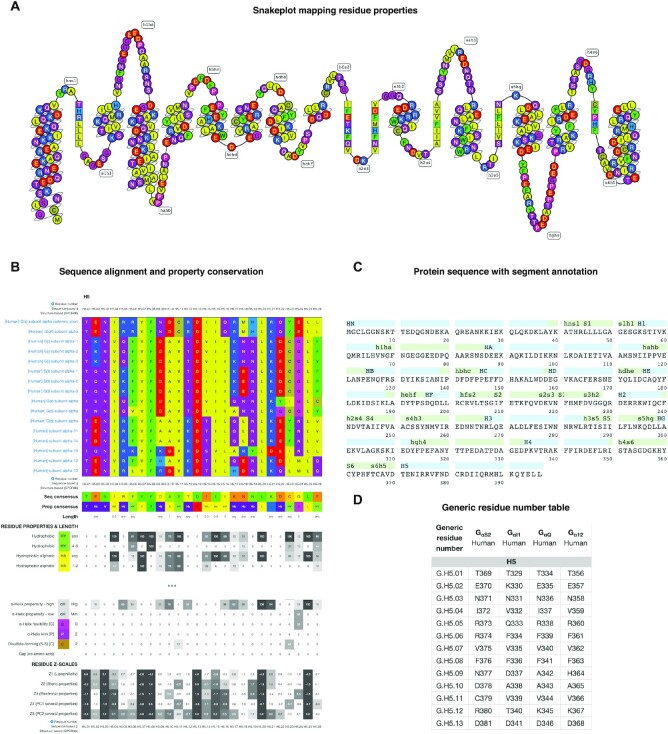
Figure 3.
Sequence data in the online G protein research platform. (A) Snakeplot visualization of amino acid topological positions and properties. All amino acids are colored by property: polarity for most but backbone modifying ability for proline and glycine and disulphide-formation for cysteine. (B) Sequence alignment of the receptor-interacting helix 5 of all human 16 Gα proteins along with conservation measures for amino acids and residue groups with similar property and size, and numeric amino acid descriptors, ‘z-scales’ (29) (from https://gproteindb.org/alignment/gproteinselection). (C) Protein sequence mapping onto segments by secondary structures (helices, β-sheet and loops). (D) Protein-specific and common residue numbers (25) for Gαs, Gαi1, Gαq and Gα12 (from https://gproteindb.org/residue/residuetable_gprot). These number tables can also be downloaded in Excel format or retrieved programmatically via a RESTFUL-API web service to integrate the numbering in any dataset and analysis method. (A, B) Taken from the ‘G protein page’ (https://gproteindb.org/signprot) for Gαs. (A–C), Common residue numbers (25) can be shown by mouse hover.

