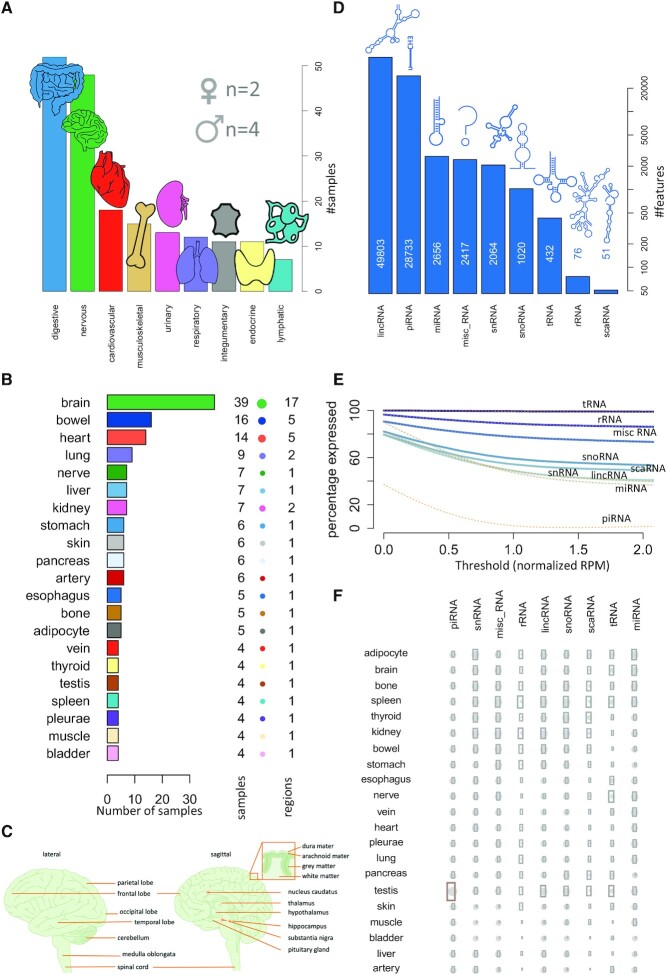
Figure 1.
Broad coverage of different organs and ncRNAs in the miRNATissueAtlas2. (A) In the study, we measured organs from nine organ systems with largest sample numbers for the digestive and the nervous system. (B) Sample counts of the different organs included in the study (bar length and number aside of the bar) together with the number of sub structures (balloon diameter and second number). Notably the numbers do not sum up to 188 samples since organs with <4 replicates were excluded from statistical considerations. (C) For the brain, 17 different sub-structures were measured. Note that the relative locations of hippocampus, substantia nigra and nucleus caudatus are indicated, but these structures are not shown, as they are in a different section. Subfigure was prepared using Motifolio Biology Illustration Toolkit (motifolio.com). (D) Number of representatives from the nine ncRNA classes included in the study. (E) Decrease of expressed representatives (on a percent scale) as a function of an increasing expression threshold (normalized read count). (F) Qualitative consideration of the number of expressed features per ncRNA class and organ. The bubble size scales linear with the number of expressed representatives (as z-scores), and the gray area scales linear with the standard deviation of the number of expressed representatives. Rows and columns are re-ordered with respect to a standard hierarchical clustering.

