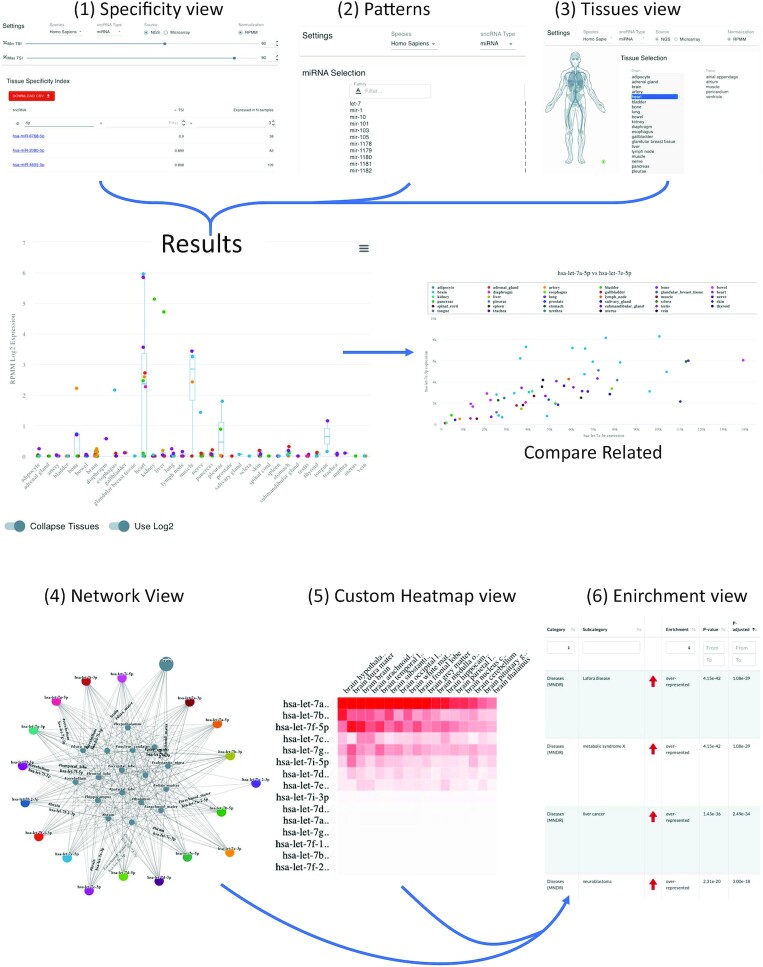
Figure 2.
The web interface and typical results. The upper part of the figure presents the three analyses that are mostly designed for the straightforward analysis of single or few sncRNAs. (1) the ‘specificity view’ where users can filter and select the RNAs of interest, the (2) patterns view and (3) organs view. By clicking on a certain RNA in any of these views, the user is directed to the detailed results page in the middle. From there, the find related functionality allows to identify related miRNAs in Homo Sapiens. On the bottom, the advanced analysis options are shown, including (4) the network view, the (5) custom heat map view and (6) the functional enrichment view.

