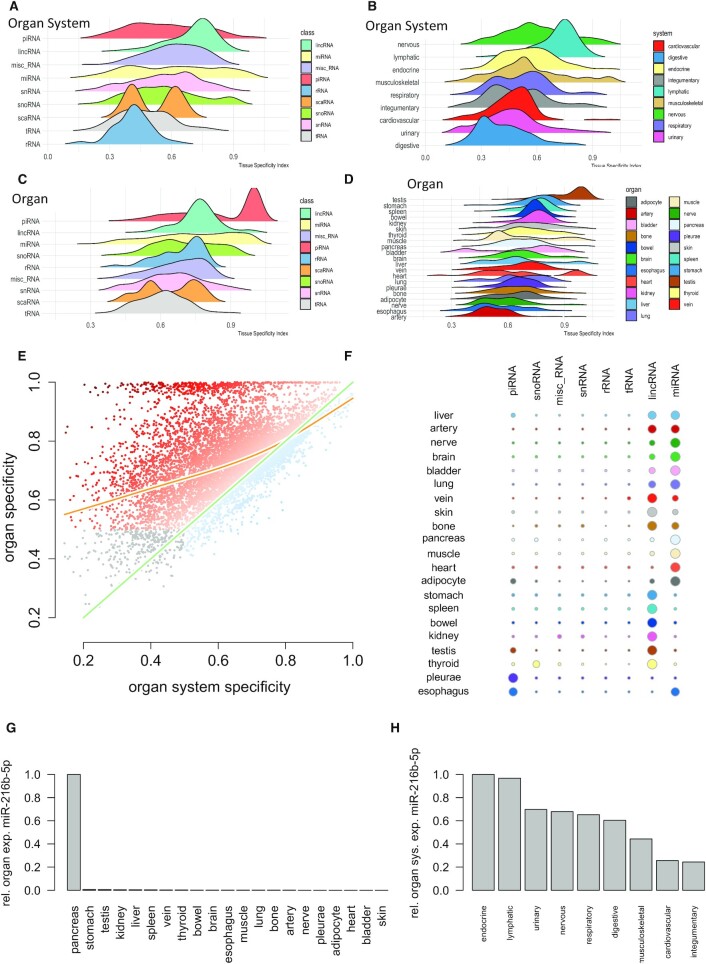
Figure 3.
Use Case 1: Specificity of ncRNA for organs and organ systems. (A) Ridgeline plots representing the distribution of the organ system specificity for the different ncRNA classes. Tissue specificity (TSI) is calculated between 0 and 1 where 0 represents ncRNAs that are not specific at all and 1 represents perfectly specific sncRNAs. The ncRNA classes are sorted with respect to decreasing average TSI with the most specific class (piRNAs) on top. (B) TSI values for the different organ systems, again sorted with respect to decreasing average TSI and the nervous system as most specific organ system on top. (C) Tissue specificity for the different ncRNA classes but computed on the organ level. While most ncRNA classes form a normal distribution, miRNAs and rRNAs are characterized by an increase towards higher tissue specificity values. The peak for piRNAs is induced by high expression of many piRNAs in testis. (D) Tissue specificity on the organ level. The overall highest specificity is found in testis, again induced by the high expression of piRNAs in this organ. (E) Scatter plot of the specificity on the organ level as compared to the organ system level. The green line represents the angel bisector (i.e. ncRNAs with equal specificity on the organ and organ system level). The orange line represents a smoothing spline with four degrees of freedom. The color of the points represents the difference between organ and organ system specificity. The dark orange dots on top are those ncRNAs with high organ but partially very low organ system specificity. Gray dots in the lower left part are those ncRNAs that reveal a very limited organ and organ system specificity. (F) For each organ and each ncRNA class, the number of specific representatives is shown as bubble using a TSI cutoff of 0.9. The bubble size scales linear with the number of representatives after transforming the numbers per organ to a z-scale (cut at -2 and 2 respectively). (G) For miR-216b-5p, the normalized expression intensity across organs is displayed. From these values, the TSI is computed according to the formula in the Materials and Methods section. In this case, the formula leads to a TSI close to 1. (H) For the same miRNA the normalized expression across organ systems is displayed. Because of an on average low expression in many organ systems the miRNA is not considered as specific for an organ system.

