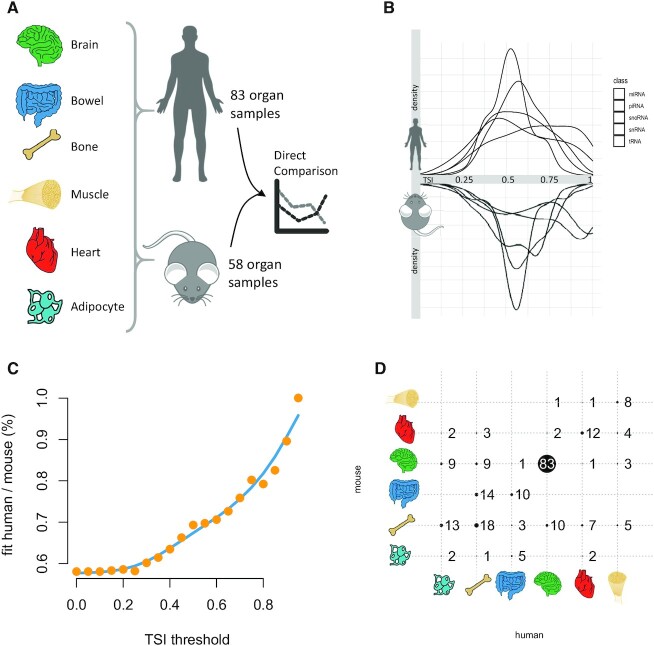
Figure 4.
Use Case 2: Concordance of the organ specificity between mouse and human. (A) For six tissues, we compared the specificity for 58 mouse samples and 83 samples from the present study. The results for the human specificity of organs and ncRNAs can be different from those presented in the work since we repeated the computations only for the subset of organs present in both organisms to avoid a bias. (B) Back-to-back histogram of the different ncRNA classes in mouse and human. (C) The percentage of organs being most specific for miRNAs in human and mouse as function of the tissue specificity threshold. If no specificity threshold is set, only the most expressed organ is compared, which is identical in around 60% of miRNAs. With increasing lower thresholds (i.e. higher percentage of specific miRNAs) the percentage of most specific organs increases to 100%. The blue line is a smoothed spline with five degrees of freedom. (D) Confusion matrix for an organ specificity threshold of 0.8. Each bubble represents the number of miRNAs for most specific organs in humans and mouse. Actual numbers are provided next to or within the bubbles. Bubbles located on the diagonal are those that match between the organisms.

