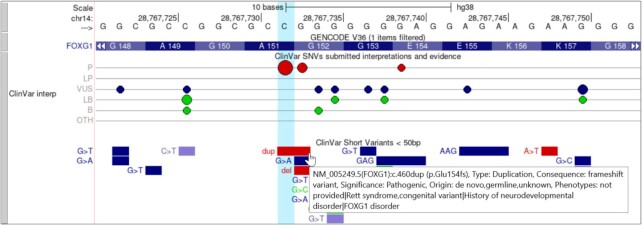
Figure 3.
The human hg38 ClinVar Interpretations and related ClinVar Short Variants track showing part of the FOXG1 gene. ClinVar Interpretations is the first track to use our bead graph display, which is a variation of our existing lollipop display. The size of the bead on the line represents the number of submissions at that genomic position. The color of the beads further aids to distinguish the categories (red = pathogenic or likely pathogenic, blue = variant of unknown significance, green = benign or likely benign). The image also demonstrates another improved feature in the ClinVar Short Variants track: expanded support for complex mouseover text on individual items, also available for track hubs.

