Figure 2.
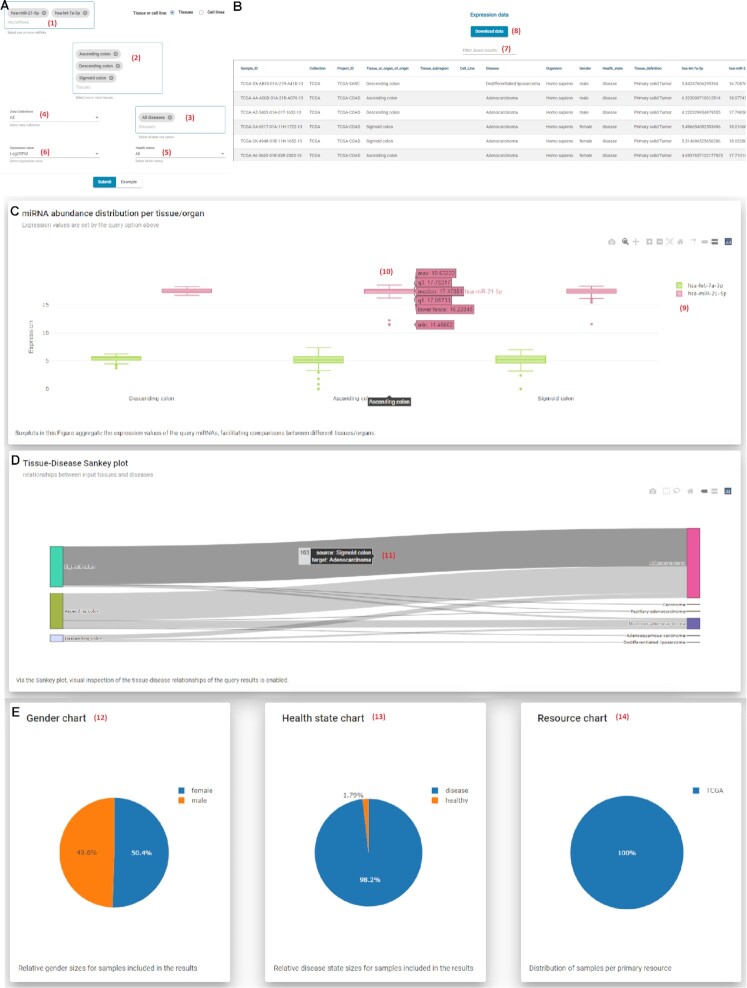
Multi-query page interface. (A) Submission form. Users may search for one or more of 2656 miRNAs (1) and Tissues (2). Both miRNAs and Tissue query boxes support free text search. Through filtering options, users may restrict their query to specific Diseases (3), Collections (4) and Health status (5). Via the Expression value drop-down menu (6), users can choose the desired expression unit that will be returned (read counts, RPM, log2(RPM)). (B) Results table. All entries compliant to the applied criteria are returned, along with their metadata and the expression values of the selected miRNAs. The results list can be customized to show 20, 50, 100, 150 and 200 items per page. A useful word-based filter, Filter-down results (7), has been implemented to narrow-down the returned entries and focus on these that contain a very specific term of interest. Users can retrieve the results of their query in tab-delimited format by clicking on the Download data button (8), without the need for any sign-up, application, or verification procedure. (C) Interactive boxplot showing the miRNA abundance distribution per tissue/organ. Users can select (9) which miRNAs are visible in the diagram offering direct comparison among miRNAs. On hover, (10) boxplots reveal the corresponding boxplot statistics (minimum, maximum, median, lower fence, first quartile and third quartile). (D) Interactive Sankey diagrams enable visual inspection of the tissue-disease relationships of the query results. On hover, (11) users may explore in more detail the distribution of samples. (E) Pie charts offer visual representation of the distribution of samples across Gender (12), Health state (13) and Collection (14) variables.

