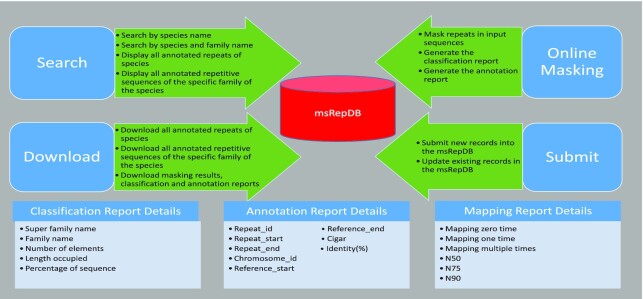
Figure 2.
The function module display of the msRepDB database. The figure mainly shows the four function modules of the msRepDB database, namely ‘Search’, ‘Download’, ‘Online Masking’ and ‘Submit’, and the detailed fields of three detection reports namely ‘Classification Report’, ‘Annotation Report’ and ‘Mapping Report’. For example, the ‘Search’ module provides the following four functions: (1) searching repeats by species name; (2) searching repeats by species name and family name; (3) displaying all annotated repeats of the species; and (4) displaying all annotation repeats of the specific family of the species. As another example, there are six fields in the mapping report: ‘Mapping zero time’, ‘Mapping one time’, ‘Mapping multiple time’, ‘N50’, ‘N75’ and ‘N90’, where ‘Mapping zero time’ indicates the proportion of fragments that cannot be aligned to the reference genome; ‘Mapping one time’ indicates the proportion of fragments that can be aligned to only one location on the reference genome; ‘Mapping multiple time’ indicates the proportion of fragments that can be aligned to many locations on the reference genome; ‘N50’ indicates the length of the longest segment such that all the segments longer than this segment cover at least 50% of the total length of all segments; ‘N75’ indicates the length of the longest segment such that all the segments longer than this segment cover at least 75% of the total length of all segments; and ‘N90’ indicates the length of the longest segment such that all the segments longer than this segment cover at least 90% of the total length of all segments.

