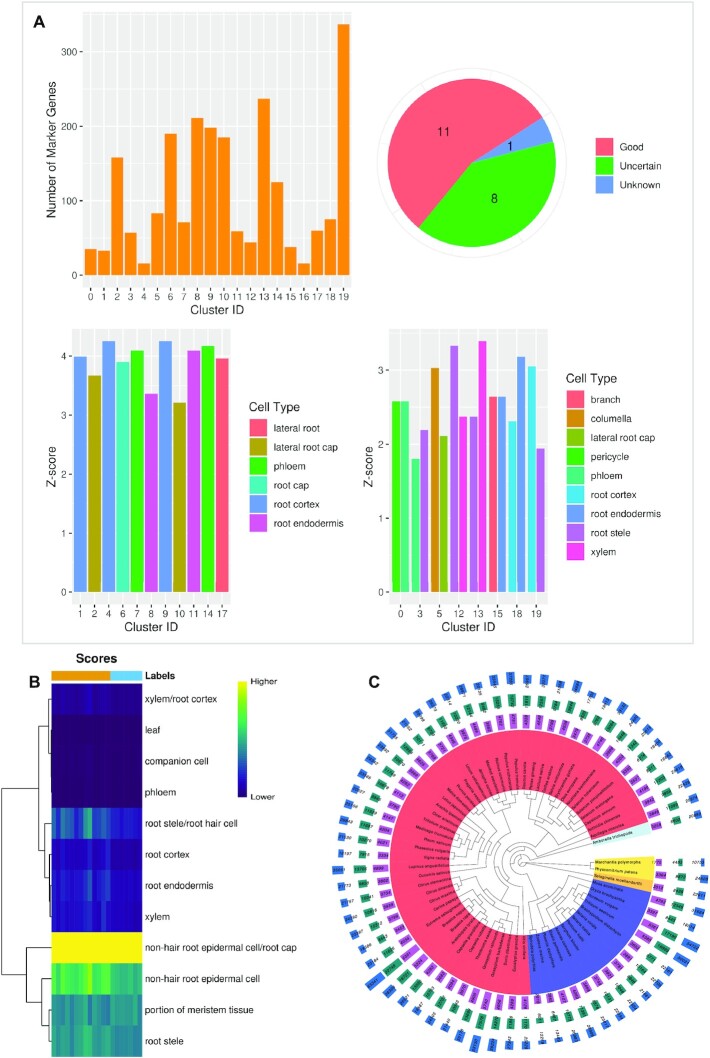
Figure 3.
PCMDB tools and number of potential marker genes for currently unsupported species. (A) The result of SCSA prediction using the default example data. Left top: The number of marker genes for each cluster of the input data. Right top: The number of clusters classified into different types (Good, Uncertain, and Unknown) by SCSA. Left bottom: Z-score of cluster label for clusters classified into the Good type. Right bottom: Z-score of top 2 cluster labels for clusters classified into the Uncertain type. (B) Heatmap based on the score of each cluster label output by SingleR using the default example data. (C) The number of potential marker genes for currently unsupported species uncovered using homology search by Arabidopsis. From inner to outer, phylogenetic tree of 67 species (different colors mean different clades based on NCBI Taxonomy Browser), the numbers of marker gene candidates identified by experimental markers, bulk RNA-seq markers, and scRNA-seq-related markers.

