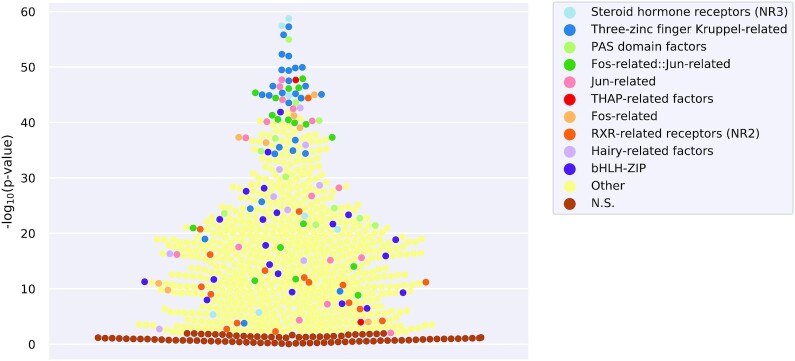
Figure 3.
TFBS differential enrichment analysis on DNase-seq data for A549 cells before and after 2 h of dexamethasone treatment. Enrichment significance for each JASPAR profile from the vertebrate CORE collection is shown in the y-axis as -log10(P) in this beeswarm plot. Each point depicts the Fisher exact test P-value (P) corresponding to a TF. The Points are colored based on the TF DBD structural family annotation, with a distinct color for each of the top 10 enriched families (see legend). Light yellow represents TF families outside of the top 10 enriched and with -log10(P) > 3 (Other) and brown represents TF families for which -log10(P) ≤ 3 (non significant, N.S.).

