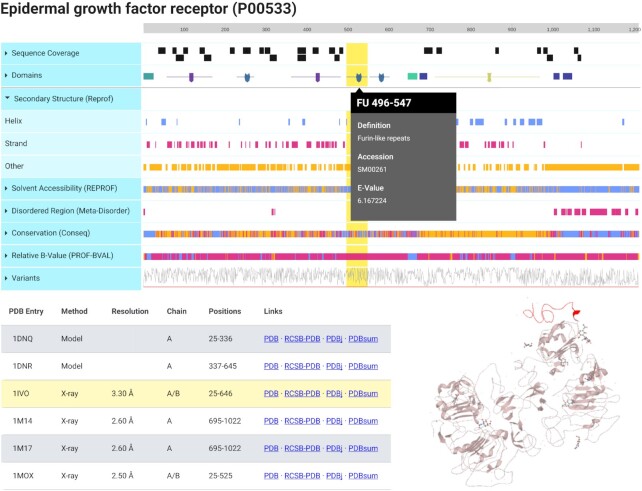
Figure 4.
Protein Feature Viewer. This interactive visualization depicts different information about the primary and secondary structure about the protein in separate tracks. Each of these tracks can be expanded to reveal a more detailed view, exemplified by the expanded predicted secondary structure. Each region of a track can be selected to reveal additional information, exemplified for the Furin-like-repeats domain. In the bottom left, the table shows available 3D structures from PDB for this proteins. The selected structure is shown in the bottom right and the selected region (yellow highlight) is marked in red in the protein structure.

