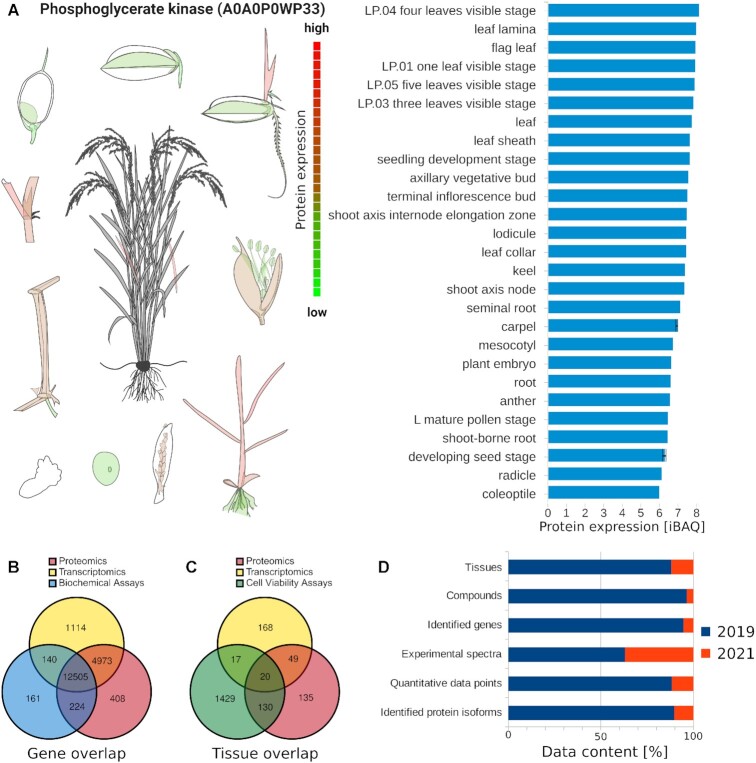
Figure 7.
New data added to ProteomicsDB. (A) Expression bodymap (left) of rice illustrated on the example for Phosphoglycerate kinase (A0A0P0WP33). The individual expression values are depicted in the barplot (right). (B) Venn diagram showing the overlap of human genes, for which proteomics, transcriptomics or biochemical assay data is available in ProteomicsDB. (C) Venn diagram showing the overlap of human tissues, cell lines and body fluids for which proteomics, transcriptomics or cell viability assay data are available in ProteomicsDB. (D) Barplot showing the increase in data across the depicted categories (y-axis) from 2019 to 2021.

