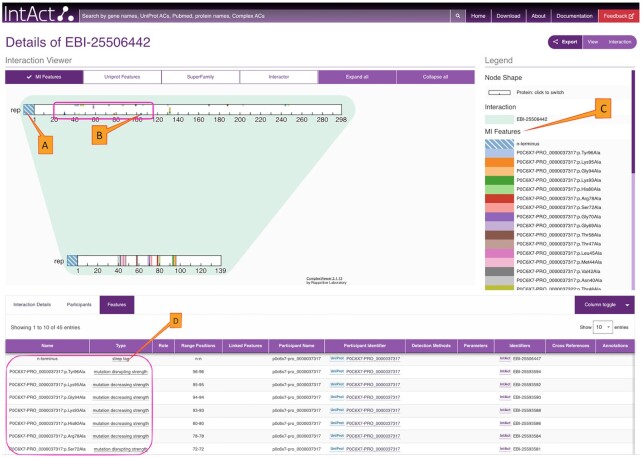
Figure 2.
This figure shows the interaction viewer for the highlighted edge from Figure 1. Features of the participants including the N-terminal tags (A) and all the mutations annotated for this interaction are displayed in the viewer (B) and also in the legend (C). All the features are mapped at the amino acid level of the proteins. Further details on the features are available from the features tab (D) below the Interaction viewer. Figure is a modified screen capture from https://www.ebi.ac.uk/intact/details/interaction/EBI-25506442.

