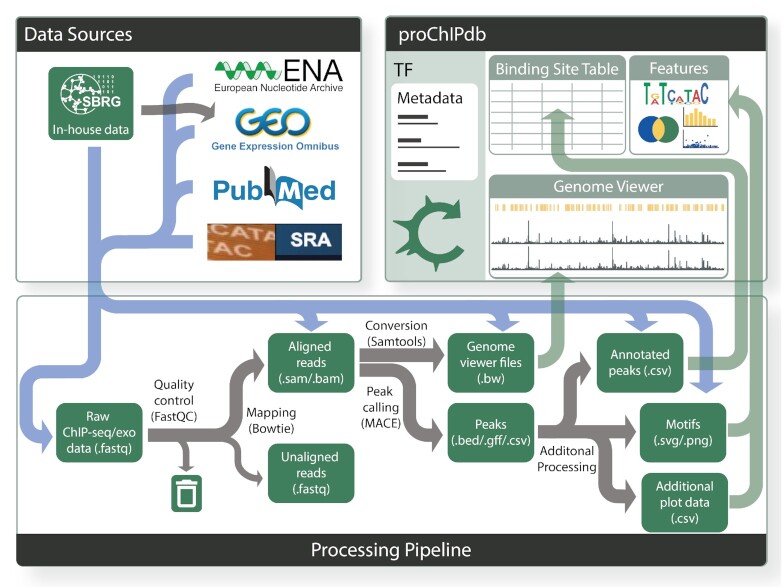
Figure 1.
Overview of proChIPdb's sources, pipeline, and content. Gray arrows in this figure present the flow of data. Data sources (upper left) include the European Nucleotide Archive, Gene Expression Omnibus (GEO), Pubmed, the Sequence Read Archive, and in-house data (which has been posted to GEO). This data enters the processing pipeline (lower) through the various file types indicated by the blue flow arrows. Processing through the pipeline occurs from left to right via the gray arrows, with green rectangles indicating data types and files and black text indicating processing steps and tools. Towards the right of the pipeline, data feeds through the green arrows into the proChIPdb site (upper right), which consists of a binding site table, genome viewer, and feature visualization panel.

