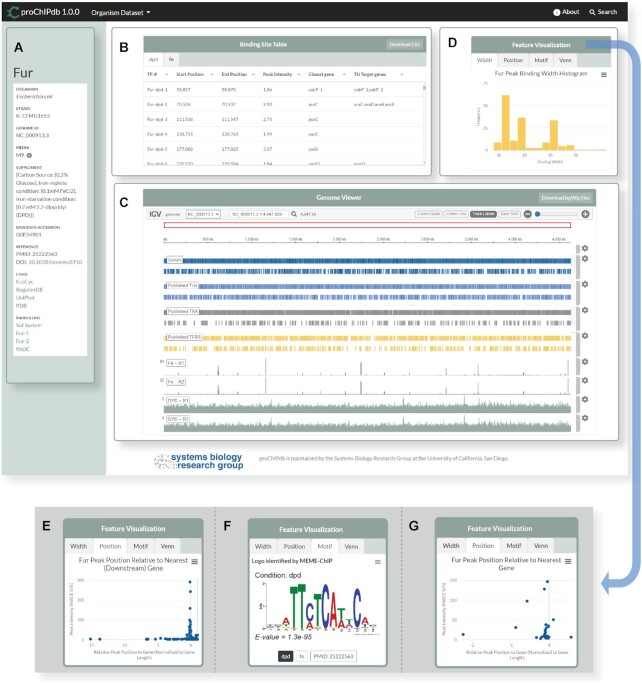
Figure 2.
TF dashboard webpage for E. coli K-12 MG1655 Fur regulator. (A) Metadata and relevant links. (B) Binding site table with curated list of binding peaks. Each tab contains the TFBSs for a unique condition (DPD versus Fe supplementation in this example). (C) Embedded Integrative Genomics Viewer (igv.js) component with annotation tracks and genome-wide peaks from raw data. (D–G) Feature visuals, which contains tabs for the various additional plots. (D) The active tab shows a histogram of binding peak widths. (E) A scatterplot of peak positions relative to their closest downstream gene. (F) The consensus binding sequence motifs.( G) Venn diagram comparing proChIPdb identified target genes versus literature regulon genes.

