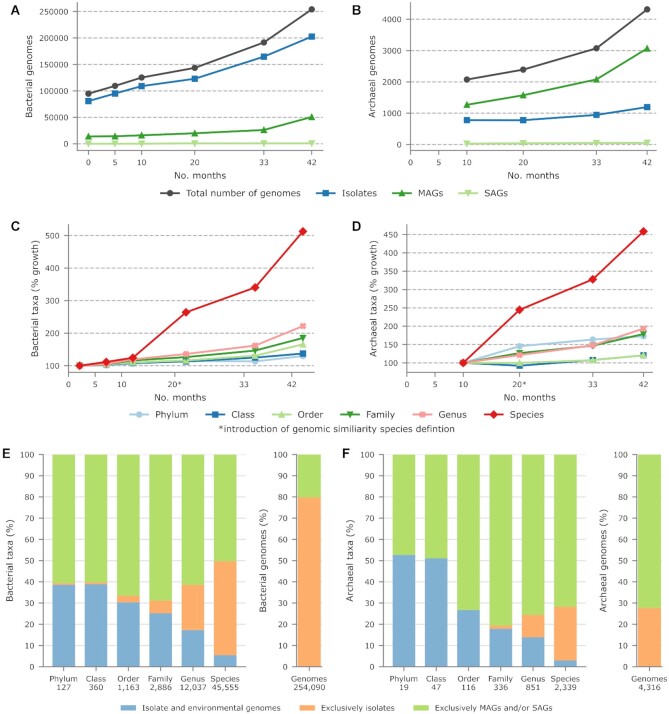
Figure 1.
Growth of the GTDB since its inception in November 2017. (A, B) Number of bacterial and archaeal isolates, MAGs, and SAGs in the GTDB along with the total number of genomes. Archaea were introduced into the GTDB starting with R03-RS86 in August, 2018. (C, D) Percent growth in the number of bacterial and archaeal taxa in the GTDB. (E, F) Proportion of bacterial and archaeal taxa at each taxonomic rank in GTDB R06-RS202 comprised exclusively of environmental genomes (MAGs and/or SAGs), exclusively of isolates, or both isolate and environmental genomes. For comparison, the proportion of isolate and environmental genomes is shown in the right bar plot.

