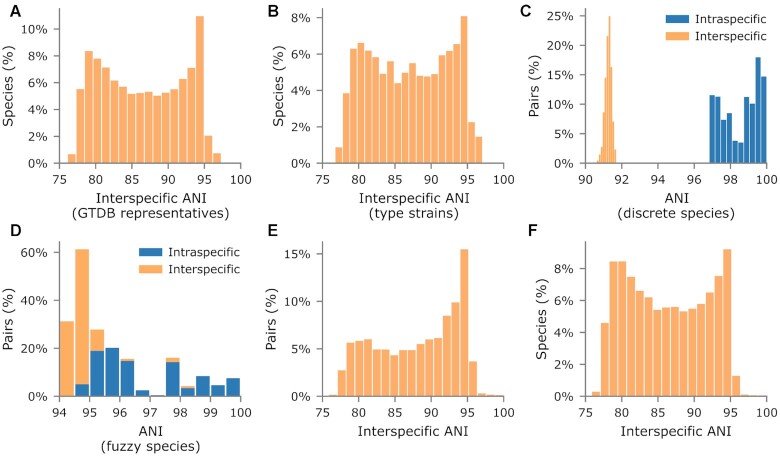
Figure 4.
Use of genomic similarity for delineating species. (A) ANI values between 36 781 GTDB species representatives and their closest representative within the same genus. (B) Same plot as in A but restricted to the 9,687 species where the GTDB representative genome is assembled from the type strain. (C) Pairwise ANI between the 24 Enterocloster bolteae and 34 E. clostridioformis genomes in GTDB RS06-RS202. (D) Pairwise ANI between the 14 Bradyrhizobium elkanii and 8 B. pachyrhizi genomes in GTDB RS06-RS202. (E) ANI between genomes and their closest genome in a different, intrageneric species cluster (108 503 total pairs). (F) ANI between the closest pairs in plot E for each of the 35 147 species considered.

