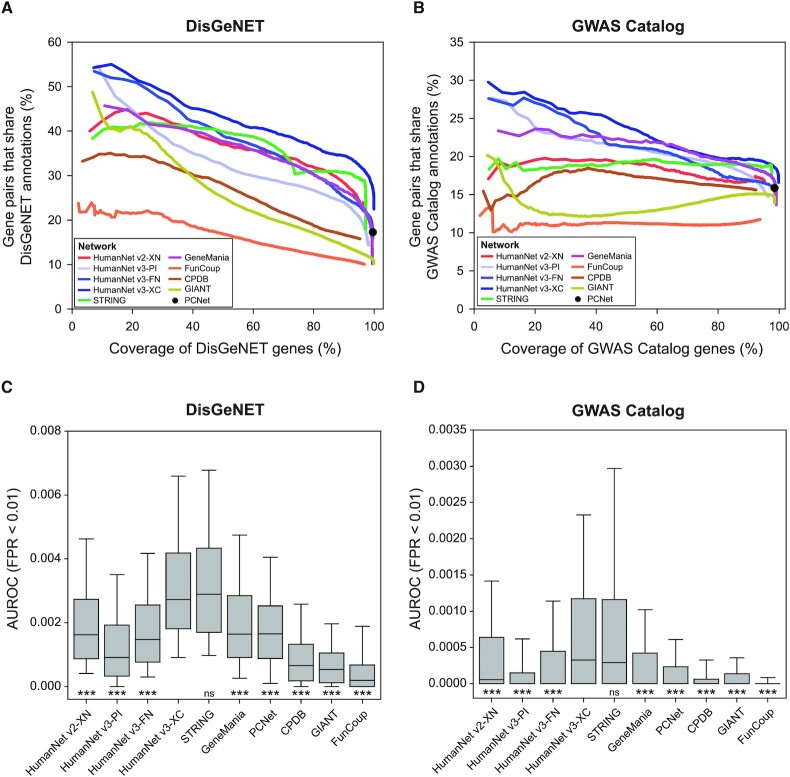
Figure 2.
Network assessment for disease gene predictions. (A, B) The percentage of gene pairs that share disease annotation (y-axis, link precision) according to the DisGeNET (A) and GWAS Catalog (B) gene coverage (x-axis, gene recall) are cumulatively calculated for every 1000 links from the top links. As the PCNet network has no link score, the link precision and gene recall are calculated for the entire link. (C, D) The area under the receiver-operating characteristic curve (AUROC) up to a false positive rate (FPR) of 1% was measured for the network-based retrieval of disease genes annotated by DisGeNET (C) or GWAS Catalog (D) (***P < 0.0001, ns: P > 0.05 according to the two-tailed Mann–Whitney U test).

