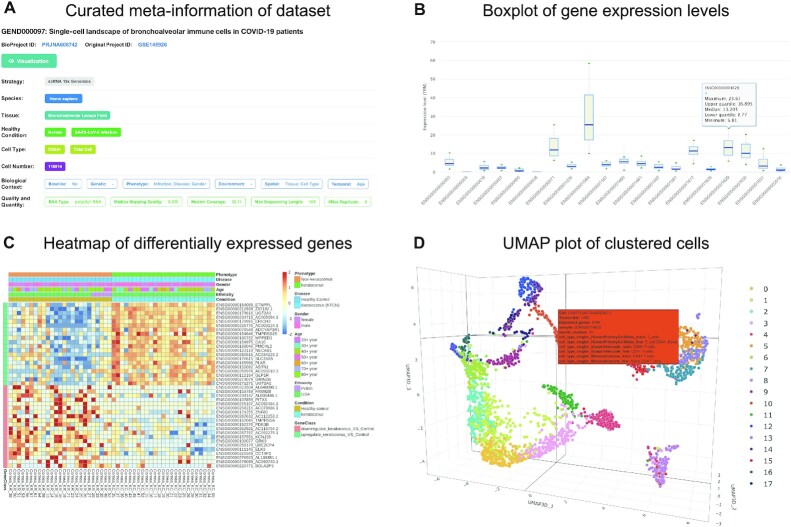
Figure 2.
Screenshots of database web interfaces. (A) Curated meta-information of dataset, including sequencing strategies, tissue, cell type, disease, biological context, quality and quantity and etc. (B) Boxplot of expression levels of multiple genes of interest across samples. (C) Heatmap of differentially expressed genes for bulk RNA-seq datasets. (D) Clustering results of single-cell RNA-seq dataset on a 3D UMAP plot where cells are color-coded by clusters.

