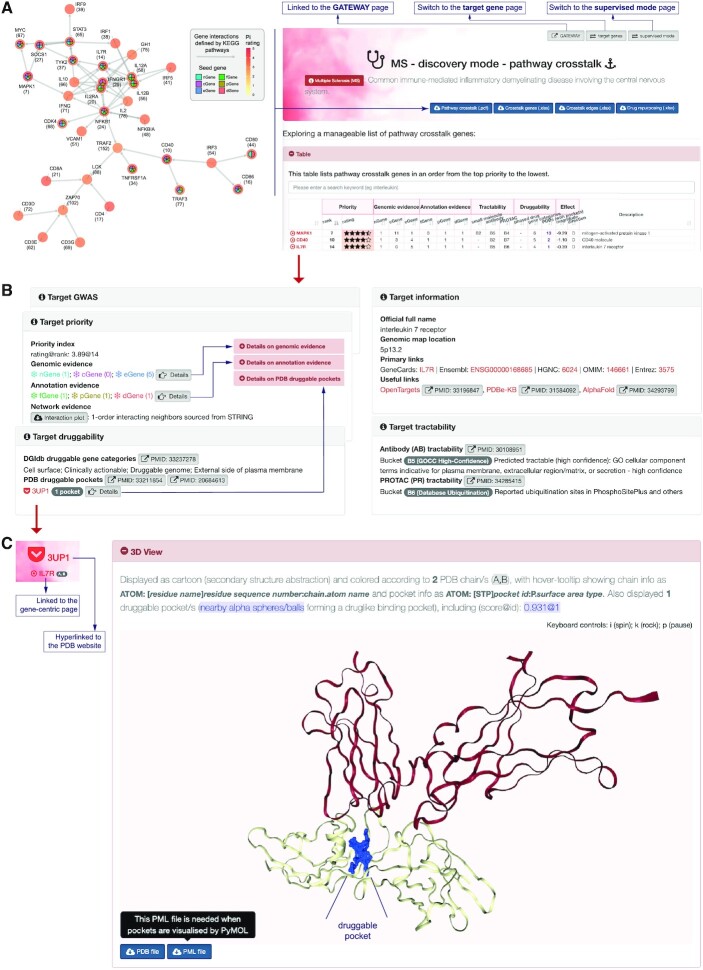
Figure 2.
The disease-specific user interfaces for exploring targets at the pathway crosstalk level and associated data, illustrated for multiple sclerosis (MS). (A) The page for exploring pathway crosstalk genes. Bottom-right: a tabular display of the top 3 genes in pathway crosstalk together with an overview of evidence, tractability, druggability and effect estimates. Left: network visualization of crosstalk genes, labeled by symbols (rank), colored by rating and embedded with evidence. Also supported upon clicks is instantly switching to, for example, the page for exploring all target genes. (B) The page for the rich cross-referencing information on one target gene, IL7R. In addition to the general information, the information on priority (and evidence used in Pi for this gene), druggability and tractability are also provided, together with links externally (e.g. AlphaFold) and internally (e.g. details on PDB druggable pockets). (C) 3D view of the protein structure, 3UP1. Shown in blue is the druggable pocket. The source files used for viewing are downloadable.

