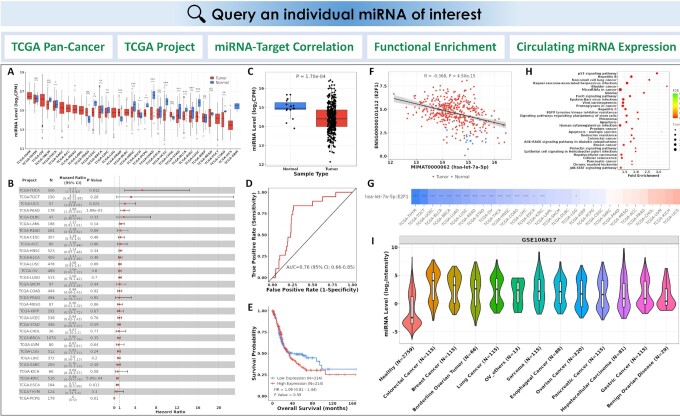
Figure 2.
CancerMIRNome outputs from the query of a miRNA of interest. (A) Pan-cancer DE analysis across all TCGA projects. (B) A forest plot visualizing pan-cancer survival analysis across all TCGA projects. (C) Boxplot of the miRNA expression in tumor and normal samples from the selected TCGA project. (D) An ROC curve illustrating the diagnostic ability of the miRNA in the selected TCGA project. (E) KM analysis of overall survival between tumor samples with high and low expression of the miRNA of interest defined by its median expression value in the selected TCGA project. (F) Correlation analysis of the miRNA with one of its targets in a TCGA project. (G) An interactive heatmap visualizing the miRNA-target correlations across all TCGA projects. (H) A bubble plot visualizing the functional enrichment of target genes for the miRNA of interest. (I) A violin plot visualizing the circulating miRNA expression in a selected circulating miRNome dataset of human cancer.

