Figure 3.
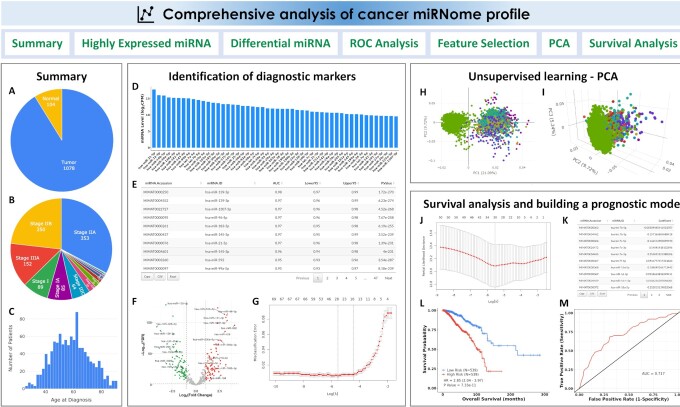
CancerMIRNome outputs from the comprehensive analysis of a miRNome dataset. (A) Pie plot showing the statistics of sample type for a TCGA project. (B) Pie plot visualizing the statistics of clinical stage for a TCGA project. (C) Distribution of age at diagnosis for the patients in a TCGA project. (D) Bar plot of top 50 highly expressed miRNAs. (E) A data table for the diagnostic markers identified by ROC analysis. (F) A volcano plot visualizing the differentially expressed miRNAs between two user-defined groups. (G) Selection of the most-relevant diagnostic miRNA biomarkers using Lasso. (H) 2D interactive visualization of principal component analysis result using the first two principal components. (I) 3D interactive visualization of principal component analysis result using the first three principal components. (J) Selection of prognostic miRNA biomarkers using the Cox-Lasso technique to develop a prognostic model. (K) Coefficients of the selected miRNAs in the prognostic model. (L) KM survival analysis evaluating the prognostic ability of the miRNA expression-based prognostic model. (M) Time-dependent ROC analysis evaluating the prognostic ability of the model.

