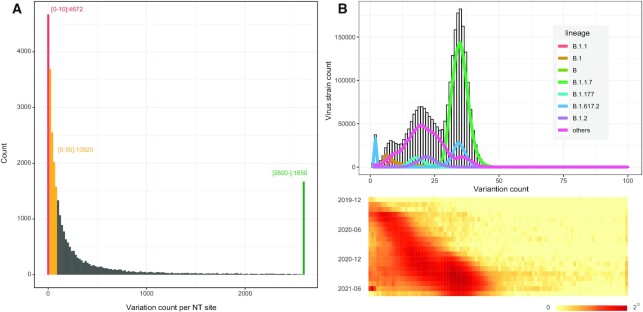
Figure 2.
Statistics of nucleotide mutation numbers in SARS-CoV-2 genomes. (A) Histogram of the mutation count at all nucleotide positions. Red, orange and green bars refer to the frequency of mutation count below 10, below 50 and above 2600, respectively. (B) Histogram of total mutation count in one strain. The heatmap shows the distribution of total mutation count in each month. Mutation counts are accumulating over time and coordinate with lineages.

