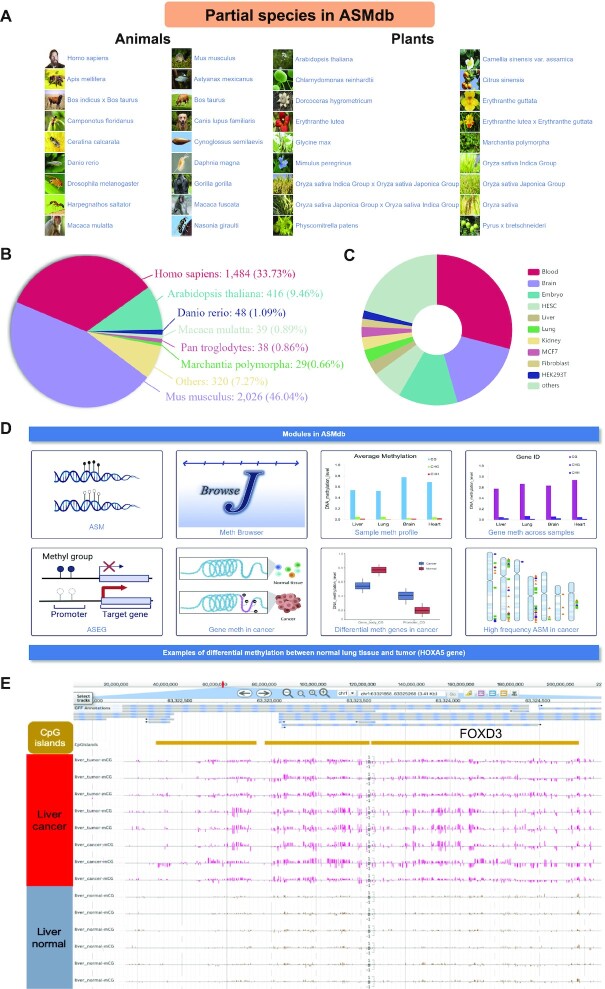
Figure 2.
Overview of ASMdb. (A) Main species included in ASMdb. (B) Proportion of BS-Seq data from various species in ASMdb. (C) Proportion of BS-Seq data from each tissue in humans. (D) Main functional modules in ASMdb. (E) An example of a genome browser screenshot around the FOXD3 gene region in human liver tissue (chr1:63321858–63325268, 3.41 kb).

