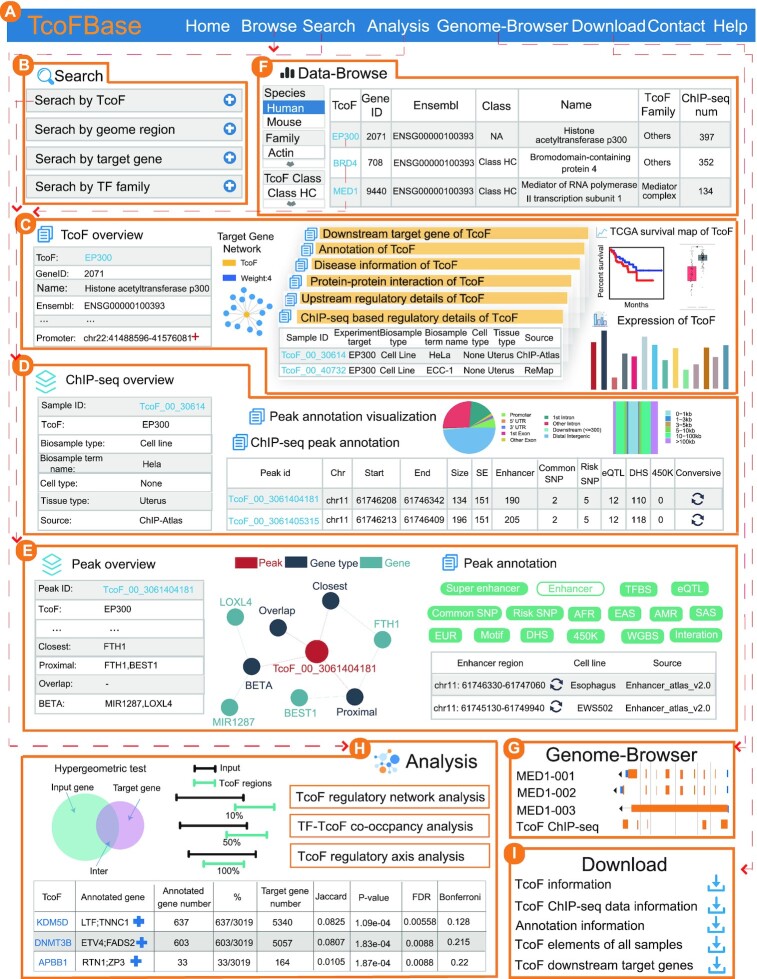
Figure 2.
Main functions and usage of TcoFBase. (A) The navigation bar of TcoFBase. (B) Four inquiry modes are available. (C) Search results including TcoF overview, detailed interactive tables of ChIP-seq information, upstream regulatory details, PPIs, disease information, annotation, expression, downstream target genes and TCGA cancer survival maps. (D) Interactive table with detailed information about ChIP-seq samples of interest and visualization of peak annotation. (E) Detailed interactive tables of annotation information and ChIP-seq peak associated genes are identified through four strategies. Network diagram about these regions is displayed. (F) Browsing TcoFs. (G) Genome browser. (H) An online analysis tools for TcoF. (I) Data download.

