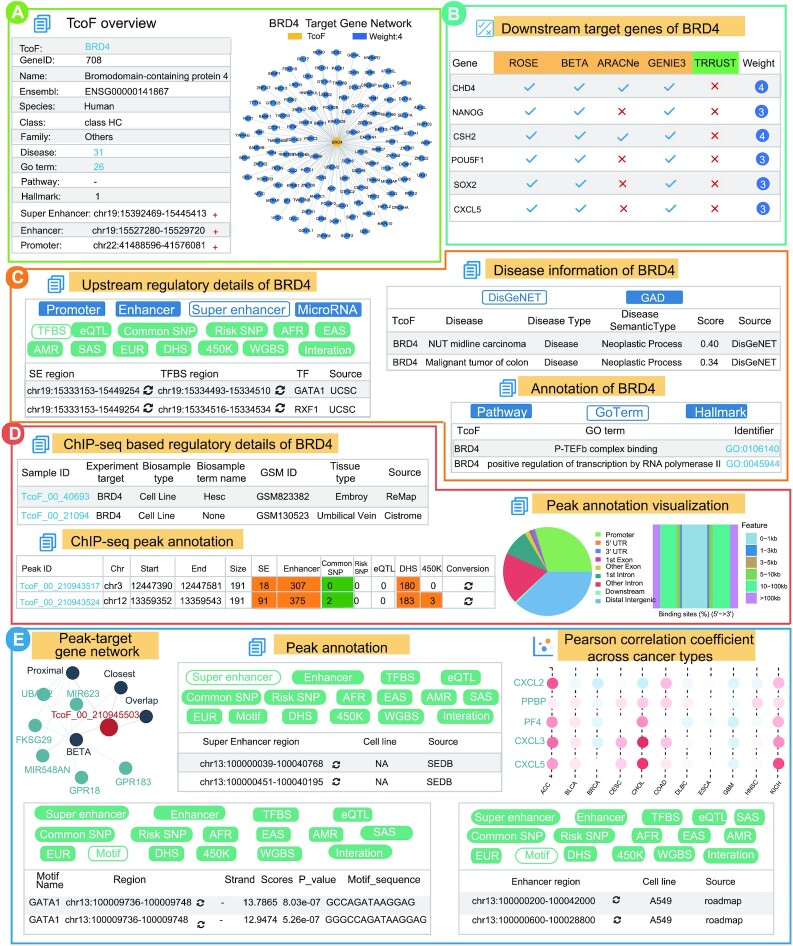
Figure 3.
Validation results associated with BRD4. (A) BRD4 overview and BRD4 target network. (B) Downstream target genes of BRD4. (C) Upstream regulatory information, disease and functional annotation of BRD4. (D) ChIP-seq information for BRD4, detailed information and visualization of peak annotation about TcoF_00_21094. (E) Peak-target gene network, detailed interactive table of annotation information (super-enhancer, motif and enhancer) of TcoF_00_210943517 and Pearson's correlation coefficients between BRD4 and downstream target genes.

