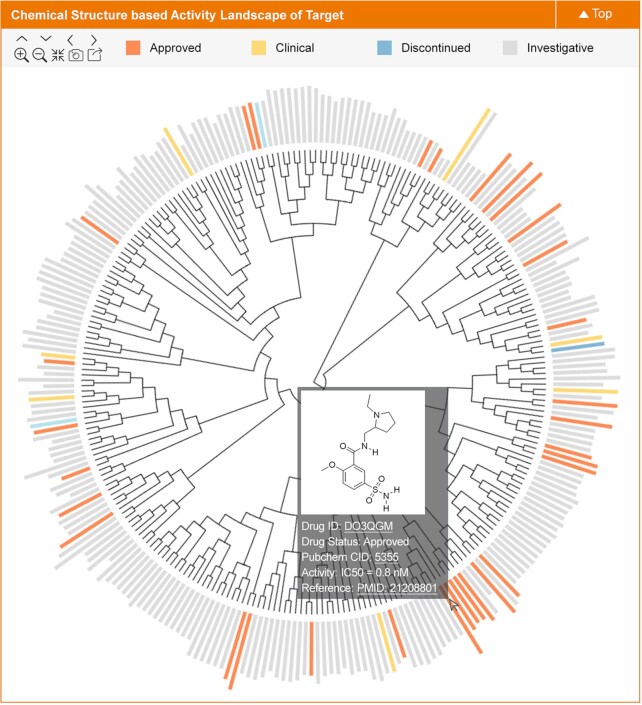
Figure 2.
A typical plot in TTD showing the chemical structure-based activity landscape for a target. All known drugs of a target are clustered based on their structural similarity. Moreover, the binding activity (e.g. –log IC50, -logKi) for each drug against the target is represented by bar chart. The color of the bar indicates the highest clinical status of the corresponding drug (approved, clinical trial, etc.). Users can move the mouse over the bar to get the basic information (status, PubChem CID, activity, etc.) of each drug. The detailed drug data can be found by clicking that particular drug.

