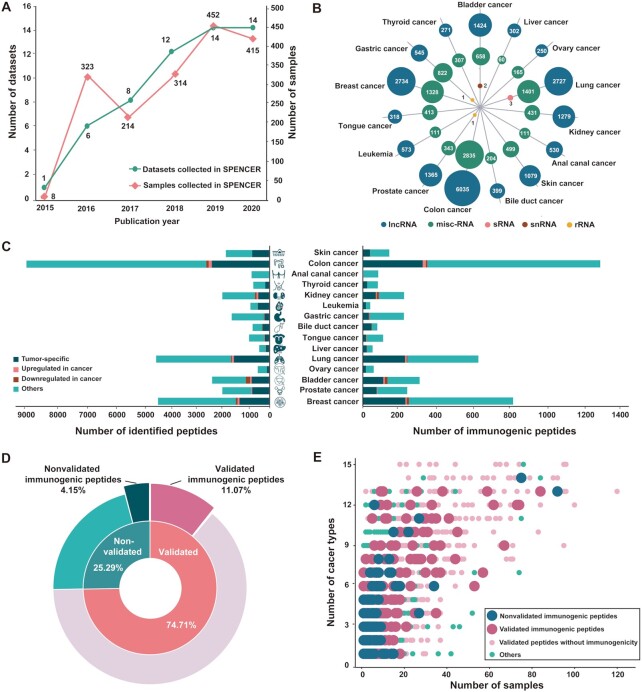
Figure 2.
Overview of the data in SPENCER. (A) Statistics on the number of cancer-related proteomic MS datasets published each year. The green line represents manually curated studies, and the pink line represents tumor patient samples. (B) The coding source of ncPEPs is shown in a bubble plot, presenting 5 different RNA types, including lncRNA (blue), misc-RNA (green), sRNA (pink), snRNA (red), and rRNA (yellow). (C) The number of total small peptides (left) and immunogenetic peptides (right) identified by SPENCER in different cancer types is shown in bar plots, with four groups: tumor-specific (deep green), upregulated in cancer (pink), downregulated in cancer (red), and others (light green). (D) The proportions of peptides with experimental evidence and immunogenicity are illustrated in a pie plot. (E) The occurrence frequency of tumor-specific and tumor-upregulated peptides in patient samples of different cancer types is shown in a dot plot.

