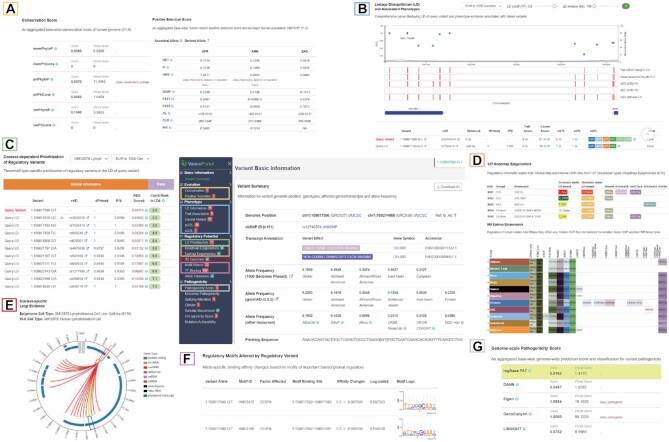
Figure 2.
Result page and distinctive web components of VannoPortal. (A) Conservation scores and positive selection scores in the ‘Evolution’ panel. (B) A composite viewer showing LD structure, disease/trait association tracks and evidence table in the ‘Phenotype’ panel. (C) Tissue/cell type-specific regulatory variant prioritization function in the ‘Regulatory potential’ panel. (D) Two rich tables displaying critical histone marks, chromatin states, and TF binding sites across hundreds of tissue/cell type-specific samples at variant locus, from Roadmap Epigenomics or EpiMap projects. (E) A circular plot showing significant 5 kb Hi-C chromatin interactions between variant locus and its target region. (F) Real-time motif scanning table for the predicted allele-specific effect of TF binding. (G) Genome-scale pathogenic scores in the ‘Pathogenicity’ panel.

