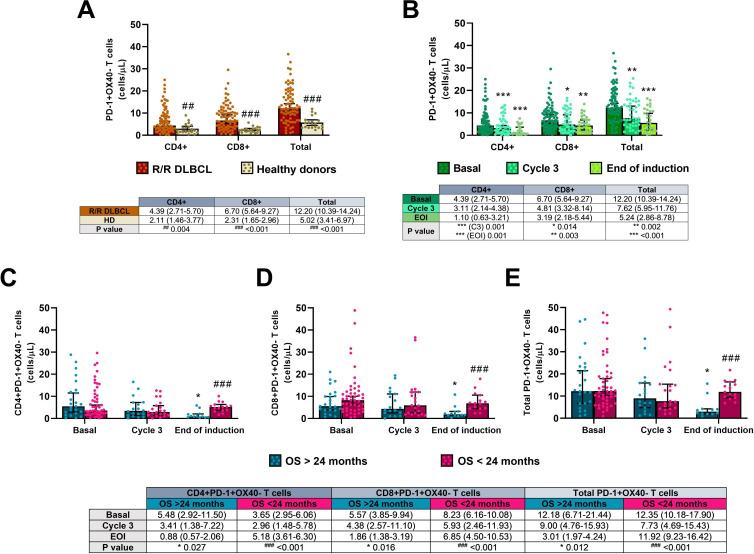
Figure 5.
Inhibited PD-1 +OX40 T cells in the R2-GDP-GOTEL clinical trial. (A) Cell concentrations before treatment compared with HD; (B) evolution of inhibited T cells during B, C3 and EOI involving all patients recruited; (C) evolution of inhibited CD4+T cells in patients with OS >24 months and OS <24 months during B, C3 and EOI; (D) evolution of inhibited CD8+T cells in patients with OS >24 months and OS <24 months during B, C3 and EOI; (E) evolution of total inhibited T cells in patients with OS >24 months and OS <24 months during B, C3 and EOI. All data shown are medians and 95% CIs of cells/L. ##P≤0.01, ###p≤0.001 comparing opposite subject groups, respectively; *p≤0.05, **p≤0.01, ***p≤0.001 compared with basal, respectively. EOI, end of induction; GOTEL, Spanish Lymphoma Oncology Group; HD, healthy donors; OS, overall survival; R2-GDP, rituximab, gemcitabine, dexamethasone, and cisplatin; R/R DLBCL, relapsed/refractory diffuse large B-cell lymphoma.

