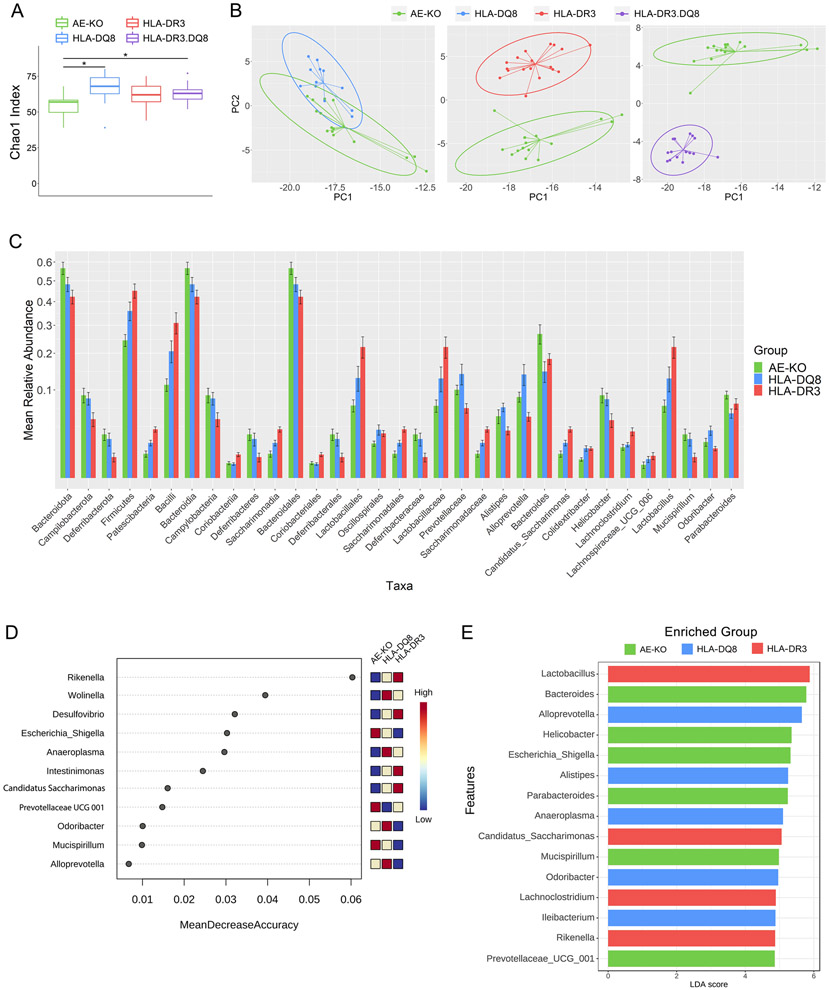
Figure 2. Distinct gut microbiota among AE-KO and HLA transgenic mice.
A) Boxplot showing unfiltered genus richness (Chao1 index) of AE-KO, HLA-DQ8, HLA-DR3, and HLA-DR3·DQ8 groups. Overall p-value: 0.0049. B) Pairwise principal coordinate analysis of beta-diversity using Euclidean distance at the genus level. Distinct separation between AE-KO and both HLA-DR3 and HLA-DR3·DQ8 while there is overlap between AE-KO and HLA-DQ8. PC1 and PC2 are the first and second principal components, respectively, and represent the most and second-most amount of variation in the bacterial abundance data between all the samples. C) Square root scaled bar plots of relative abundances of significant taxa at each taxonomic level with relative abundance >0.002. D) Top 15 important features selected by random forest. Removing Rikenella from the feature-set available to the model led to approximately a 16% decrease in classification accuracy. Removing Desulfovibrio led to around a 10% decrease in accuracy. E) Top 15 significant genera selected by LEfSe analysis, LDA score reflecting their effect sizes, and the heatmap on the right depicting whether they were high, medium, or low in AE-KO, HLA-DQ8, and HLA-DR3 groups from left to right.

