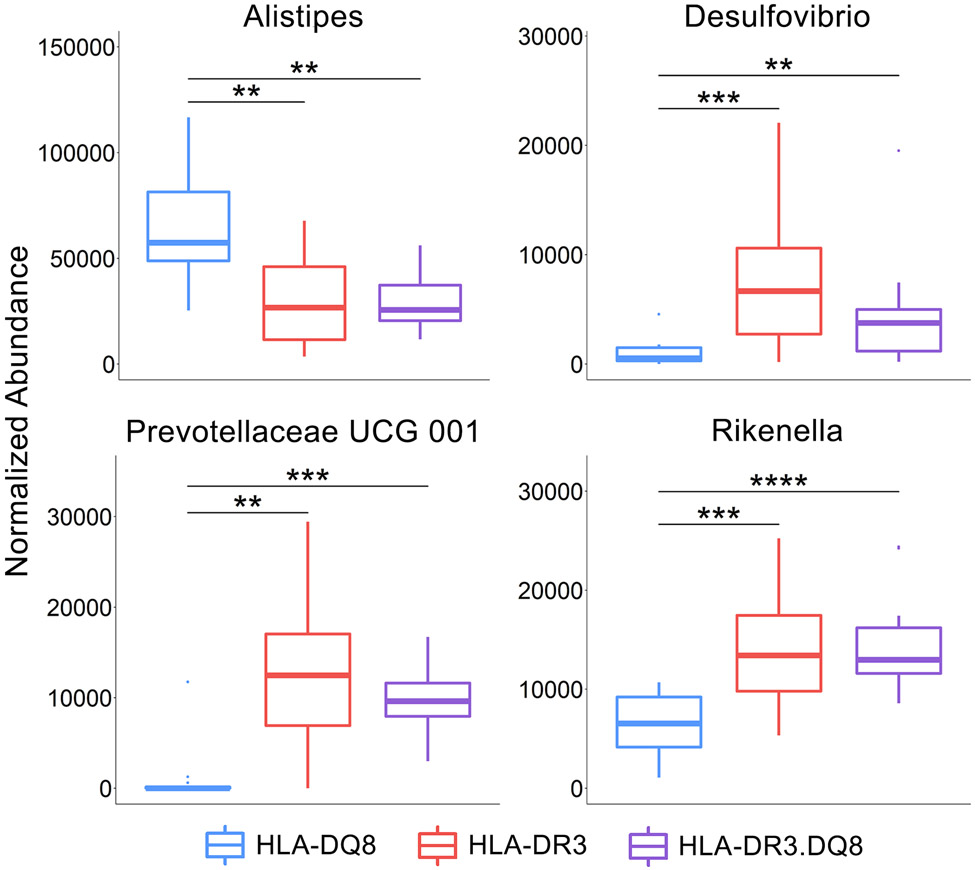
Figure 6. Differentially abundant bacteria in HLA-DQ8 mice.
Abundance values are Sum-scaled to one million. The three lines represent the lower quartile, median, and upper quartile from lowest to highest, respectively. Significance labels: **** indicates p-value < 0.001, *** indicates 0.01>p>0.001, ** indicates 0.05>p>0.01, and * indicates p<0.05.

