
Figure 2. High salt restricts Viperin expression and IFN‐I‐induced antiviral activity.
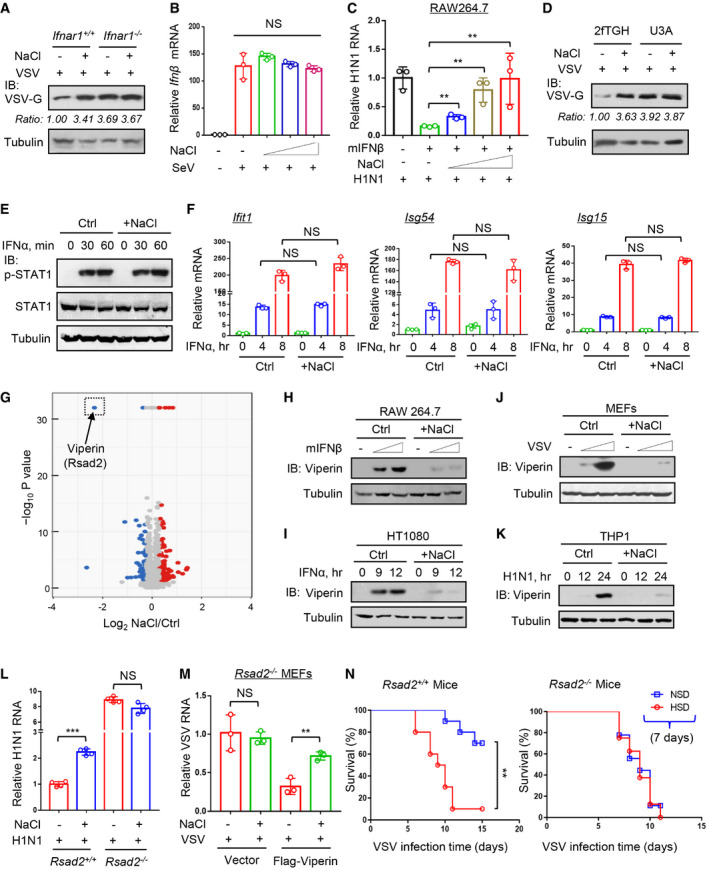
- Western blot analysis of VSV‐G protein levels in Ifnar1+/+ or Ifnar1 −/− MEF cells infected with VSV (MOI = 1.0, 24 h) immediately after addition of NaCl (+34 mM).
- RT–qPCR analysis of Ifnβ mRNA levels in HT1080 cells infected with SeV (MOI = 1.0, 10 h) immediately after addition of NaCl (+17, 34 and 51 mM).
- RAW264.7 cells were treated with mIFNβ (50 IU/ml, 20 h) immediately after addition of NaCl (+17, 34, and 51 mM). After washing, cells were infected with H1N1 (MOI = 1.0, 24 h) and viral RNA levels were analyzed by RT–qPCR.
- Western blot analysis of VSV‐G protein levels in U3A (STAT1‐deficient) and its parental cells 2fTGH infected with VSV (MOI = 1.0, 24 h) immediately after addition of NaCl (+34 mM).
- Western blot analysis of STAT1‐Tyr701 phosphorylation (p‐STAT1) in HEK293T pretreated with additional NaCl (+34 mM) or control ddH2O (Ctrl) for 12 h and then treated with IFNα (1,000 IU/ml) as indicated.
- RT–qPCR analysis of Ifit1, Isg54, and Isg15 mRNA levels in HEK293T pretreated with additional NaCl (+34 mM) for 12 h and then treated with IFNα (1,000 IU/ml) as indicated.
- RAW264.7 cells were treated with mIFNβ (500 IU/ml) for 12 h immediately after addition of NaCl (+34 mM) or control ddH2O (Ctrl). Whole cell lysates were subjected to a quantitative proteomic analysis with a TMT2‐plex method to identify the differentially expressed proteins. The upregulated and downregulated proteins were analyzed in the volcano plot. The most dramatically downregulated ISG protein, Viperin (Rsad2), was marked in the dotted frame.
- Western blot analysis of Viperin protein in RAW264.7 treated with mIFNβ (100 and 500 IU/ml, 12 h) immediately after addition of NaCl (+34 mM).
- Western blot analysis of Viperin protein in HT1080 treated with IFNα (1,000 IU/ml) and NaCl (+34 mM) as (H).
- Western blot analysis of Viperin protein in MEF cells infected with VSV (MOI = 0.5 and 1.0, 24 h) immediately after addition of NaCl (+34 mM).
- Western blot analysis of Viperin protein in THP1 infected with H1N1 (MOI = 1.0) immediately after addition of NaCl (+34 mM).
- RT–qPCR analysis of viral RNA levels in Rsad2+/+ or Rsad2 −/− MEF cells infected with H1N1 (MOI = 1.0, 24 h) immediately after addition of NaCl (+34 mM).
- Rsad2 MEF cells were transfected with empty vectors or Flag‐Viperin, and then infected with VSV (MOI = 1.0, 24 h) immediately after addition of NaCl (+34 mM). Viral RNA levels were analyzed by RT‐qPCR.
- Survival curves of 8‐week‐old Rsad2 +/+ or Rsad2 −/− mice administrated with an NSD or HSD for 7 days and then intraperitoneally infected with VSV (1 × 10⁸ PFU per gram body mouse, n = 10).
Data information: Data (B, C, F, L, M) represent mean and SD of three (B, C, F, M) or four (L) biological replicates, and P‐values were calculated using two‐tailed unpaired Student’s t‐test; Data (A, D, E, H‐K) are representative of at least two biological replicates; Data (N) show the mean and SEM of 10 biological replicates, and P‐value was calculated using logrank (Mantel–Cox) tests. For all statistical testing: NS, not significant (P > 0.05), **P < 0.01 and ***P < 0.001.
Source data are available online for this figure.