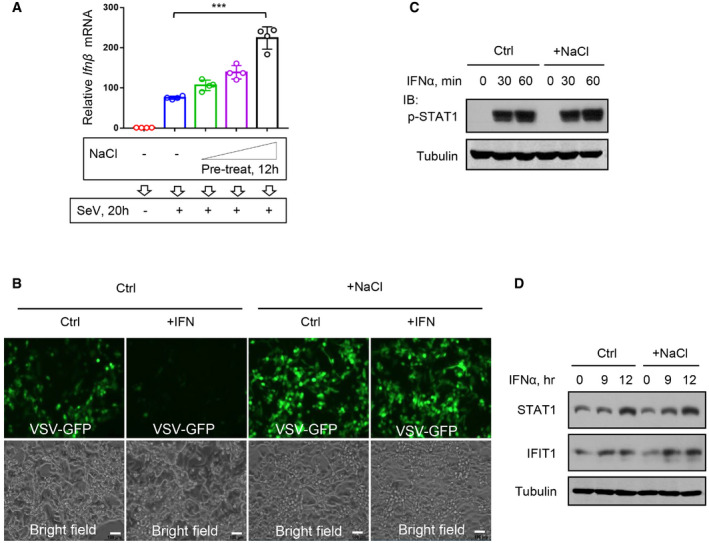
Figure EV2. High salt does not affect IFN‐I‐induced signaling.

- RT–qPCR analysis of IFNβ mRNA levels in HT1080 cells pretreated with additional NaCl (+17, 34, and 51 mM) for 12 h and then infected with SeV (MOI = 1.0) for 20 h.
- 2fTGH cells were treated with IFNα (50 IU/ml, 20 h) immediately after addition of NaCl (+34 mM). After washing, cells were infected with VSV‐GFP (MOI = 0.1, 24 h) and then viruses were observed by fluorescence. Scale bars, 10 μm.
- Western blot analysis of STAT1‐Y701 phosphorylation (p‐STAT1) in HEK293T cells treated with additional NaCl (+34 mM, 12 h) and then stimulated with IFNα (1,000 IU/ml) for 30 and 60 min.
- Western blot analysis of STAT1 and IFIT1 levels in HEK293T cells stimulated with IFNα (1,000 IU/ml) immediately after addition of NaCl (+34 mM) as indicated.
Data information: Data (A) represent mean and SD of four biological replicates; Data (C, D) are representative of at least two biological replicates. For all statistical testing: P‐values were calculated using two‐tailed unpaired Student’s t‐test. ***P < 0.001.
Source data are available online for this figure.
