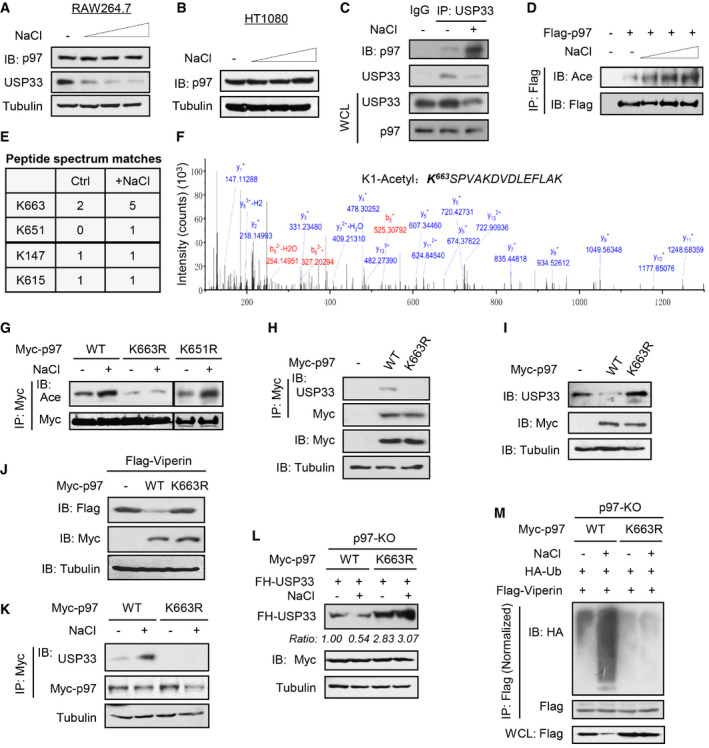
Figure 6. High salt promotes p97 acetylation to recruit USP33 for degradation.

-
A, BWestern blot analysis of p97 levels in RAW264.7 (A) or HT1080 (B) cells treated with additional NaCl (+17, 34 and 51 mM) for 12 h.
-
CImmunoprecipitation analysis of the interaction between USP33 and p97 in RAW264.7 treated with additional NaCl (+34 mM) for 12 h.
-
DImmunoprecipitation analysis of acetylation of Flag‐p97 in HEK293T cells transfected with Flag‐p97 and then treated with additional NaCl (+17, 34 and 51 mM) for 12 h.
-
E, FMass spectrometry analysis of acetylation of Flag‐p97 (E) in RAW264.7 transfected with Flag‐p97 and then treated with additional NaCl (+34 mM) or control ddH2O (Ctrl) for 12 h. The intensity of p97‐K663 site was shown in (F).
-
GImmunoprecipitation analysis of acetylation of Myc‐p97 in HEK293T cells transfected with Myc‐p97 (WT, K663R or K651R) and then treated with additional NaCl (+34 mM) for 12 h.
-
HImmunoprecipitation analysis of the interaction between USP33 and Myc‐p97 in HEK293T cells transfected with Myc‐p97 (WT or K663R).
-
IWestern blot analysis of USP33 levels in HEK293T cells transfected with empty vectors (−) or Myc‐p97 (WT or K663R).
-
JWestern blot analysis of Flag‐Viperin levels in HEK293T cells co‐transfected with Flag‐Viperin and Myc‐p97 (WT or K663R).
-
KImmunoprecipitation analysis of the interaction between USP33 and Myc‐p97 in HEK293T cells transfected with Myc‐p97 (WT or K663R) and then treated with additional NaCl (+34 mM) for 12 h.
-
LWestern blot analysis of FH‐USP33 levels in p97‐KO HEK293T cells co‐transfected with Myc‐p97 (WT or K663R) and Flag‐USP33, and then treated with additional NaCl (+34 mM) for 12 h.
-
MImmunoprecipitation analysis of Viperin ubiquitination in p97‐KO 2fTGH cells co‐transfected with Myc‐p97 (WT or K663R), Flag‐Viperin, and HA‐Ub as indicated, and then treated with additional NaCl (+34 mM) for 12 h.
Data information: Data (A–D, G–M) are representative of at least two biological replicates.
Source data are available online for this figure.
