
Figure 7. A low‐salt diet during viral infection improves Viperin expression and host antiviral ability.
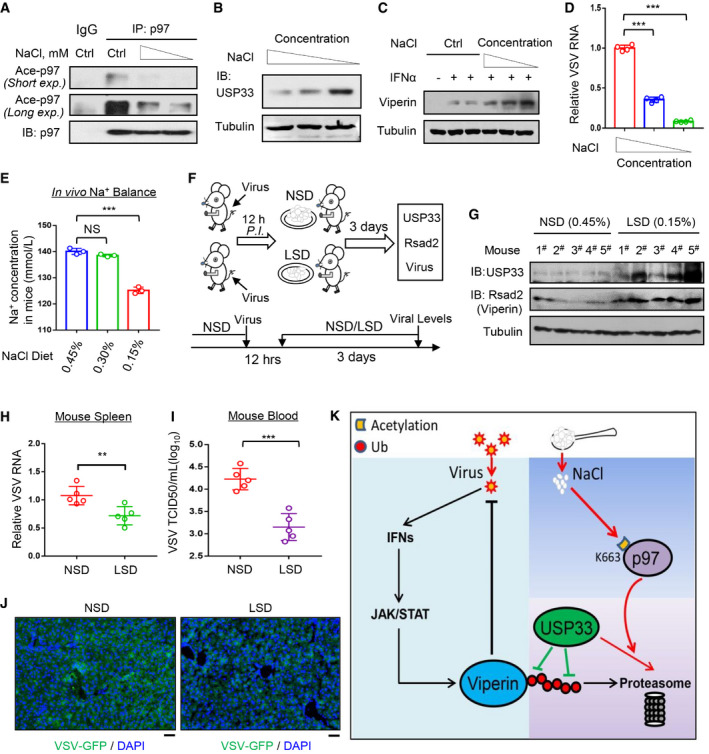
- Immunoprecipitation analysis of acetylation of p97 in RAW264.7 cells cultured in media containing reduced concentration of NaCl (−17 and −34 mM) for 12 h.
- Western blot analysis of USP33 in RAW264.7 cells cultured in media containing reduced concentration of NaCl (−17 and −34 mM) for 12 h.
- Western blot analysis of Viperin in HT1080 cells treated with IFNα (1,000 IU/ml, 12 h) in media containing reduced concentration of NaCl (−17, −34 and −51 mM).
- RAW264.7 cells were infected with VSV (MOI = 1.0, 12 h) in media containing reduced concentration of NaCl (−17 and −34 mM). Viral RNA levels were analyzed by RT‐qPCR.
- Mice (n = 3) were fed an NSD (0.45% NaCl) or LSD (0.30% or 0.15% NaCl) for 3 days. Na+ concentration in mouse serum was analyzed by a Micro Blood Sodium Concentration Assay Kit.
- Schematic diagram of analysis of in vivo viral levels in VSV‐infected mice fed either an NSD (0.45% NaCl) or LSD (0.15% NaCl).
- Western blot analysis of USP33 and Viperin protein levels in the spleen tissues of mice (n = 5) fed an NSD (0.45% NaCl) or LSD (0.15% NaCl) for 3 days as indicated.
- Mice (n = 5) were intraperitoneally infected with VSV (1 × 10⁸ PFU per gram body). Twelve hours post infection, mice were fed an NSD (0.45% NaCl) or LSD (0.15% NaCl) for 3 days. Then VSV RNA levels in mouse spleen tissues were detected by RT‐qPCR.
- Virus titers in the mouse blood (n = 5) from (H) were analyzed by the TCID50 assay.
- Immunofluorescence analysis of the amount of VSV‐GFP in liver tissues of mice intraperitoneally infected with VSV‐GFP (1 × 10⁷ PFU per gram body) and then fed an NSD/LSD as (H). Scale bars, 20 µm.
- A proposed model of high‐salt‐mediated restriction of host antiviral ability by activating p97 acetylation and subsequent degradation of the deubiquitinase USP33 and antiviral protein Viperin.
Data information: Data (A–C, G) are representative of at least two biological replicates; Data (D) represent mean and SD of four biological replicates; Data (E, H, I) show mean and SEM of three (E) or five (G–I) biological replicates. For all statistical testing: P‐values were calculated using two‐tailed unpaired Student’s t‐test. N.S, not significant (P > 0.05) and **P < 0.01, ***P < 0.001 (two‐tailed unpaired Student’s t‐test).
Source data are available online for this figure.