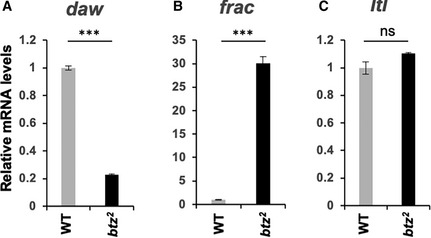
Figure EV2. Target gene expression in btz homozygotes.

-
A–CRelative mRNA levels measured by qRT–PCR for daw (A), frac (B), and ltl (C) in btz2 homozygous larval carcasses compared to wild‐type (Canton S). daw and frac show changes consistent with those seen in btz2 /Df(3R)BSC497, but the change in ltl levels is not significant. ***P < 0.001; ns, not significant by unpaired t‐test. n = 3 for each sample. Error bars show mean ± SD.
