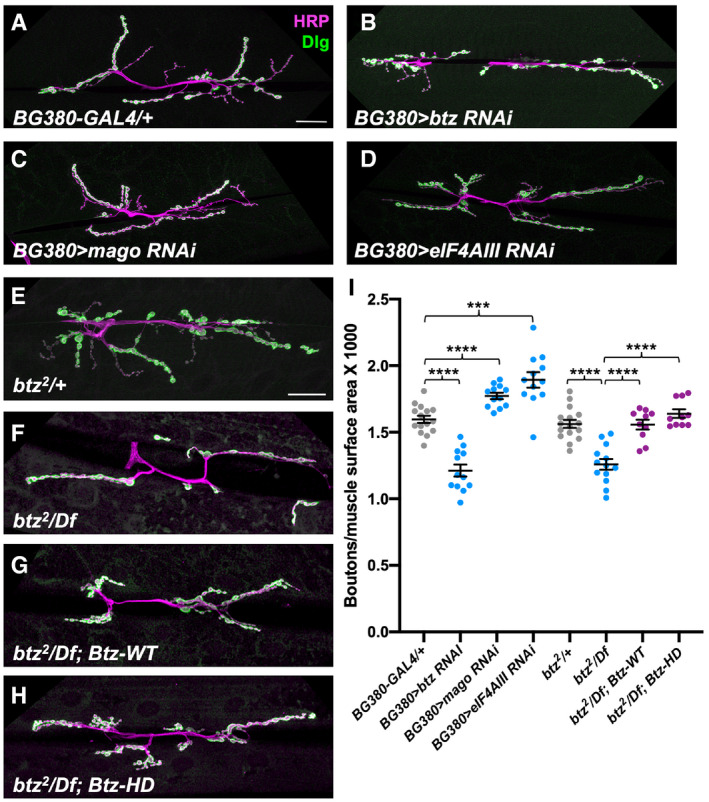
Figure 4. Btz controls NMJ size independently of the EJC.

-
A–HConfocal images of the NMJ on larval muscles 6 and 7 in segment A3, stained with anti‐HRP (magenta) and anti‐Dlg (green). (A) BG380‐GAL4/+ control; (B) BG380‐GAL4/+; UAS‐btz RNAi/+; (C) BG380‐GAL4/+; UAS‐mago RNAi/+; (D) BG380‐GAL4/+; UAS‐eIF4AIII RNAi/+; (E) btz2 /+ control; (F) btz2 /Df(3R)BSC497; (G) Btz‐WT; btz2 /Df(3R)BSC497; (H) Btz‐HD; btz2 /Df(3R)BSC497. Scale bars, 30 μm (shown in A for A‐D and in E for E‐H).
-
IQuantifications of the number of boutons normalized to muscle surface area (×1,000) in the indicated genotypes. ****P < 0.0001; ***P < 0.001 by unpaired t‐test or Mann–Whitney test. n = 15 (BG380‐GAL4), n = 12 (BG380>btz RNAi; BG380>mago RNAi; BG380>eIF4AIII RNAi), n = 16 (btz/+), n = 13 (btz/Df), or n = 10 (Btz‐WT; btz/Df; Btz‐HD; btz/Df). Error bars show mean ± SEM. NMJ size is reduced by knocking down btz in motor neurons, but slightly increased by knocking down mago or eIF4AIII. The size deficit in btz mutants is equally well rescued by the wild type or EJC interaction‐defective btz transgenes.
Source data are available online for this figure.
