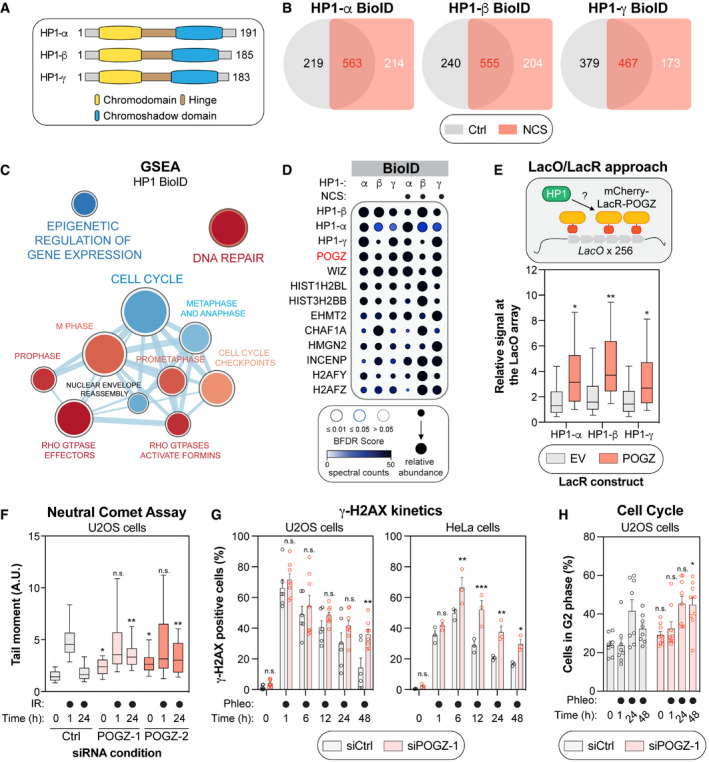
Schematic of the three human isoforms of the heterochromatin protein 1 (HP1). The N‐terminal chromodomain of HP1 (in yellow) recognizes H3K9 methylation in vitro, with a preference for higher methylation states (H3K9me1 > H3K9me2 > H3K9me3), while the chromoshadow domain at its C‐terminus (in blue) is involved in homo‐/hetero‐dimerization as well as interaction with other proteins containing a PXVXL motif. Both domains are separated by a hinge region (in brown).
Venn diagram outlining the distribution of HP1‐α, ‐β and ‐γ high‐confidence interactors identified by the BioID approach, under control (Ctrl; DMSO) or genotoxic conditions (NCS).
Gene set enrichment analysis (GSEA) visualization of the common HP1 high‐confidence interactors using Reactome pathways. Enrichment maps were developed with a ranked interaction network (
P < 0.2, FDR < 0.5 and overlap coefficient = 0.75) and the cell cycle cluster is provided in this panel. The complete interaction network can be found in Fig
EV1D. Pathways enriched in: (i) control conditions are represented in blue; (ii) NCS‐treated conditions are represented in red.
Dot plot of selected HP1 high‐confidence interactors identified by BioID. The node size displays the relative abundance of a given prey across the six conditions analysed, the node colour represents the absolute spectral count sum (capped at 50 for display purposes), and the node edge colour corresponds to the Bayesian False Discovery Rate (BFDR). Proteins were selected based on a SAINT score of > 0.95, BFDR of < 0.05 and ≥ 10 peptide count.
Schematic representing the LacO/LacR tethering system in U2OS cells (top panel). Quantification of the endogenous HP1 signal at the mCherry focus upon expression and tethering of mCherry‐LacR alone (EV) or a construct containing POGZ. Data are represented as a box‐and‐whisker (10‐90 percentile; bottom panel). At least 100 cells per condition were counted. Significance was determined by one‐way ANOVA followed by a Tukey test. *P < 0.05, **P < 0.0001.
U2OS cells containing a non‐targeting siRNA control (Ctrl), or one of two siRNA(s) against human POGZ (POGZ‐1 or ‐2), were irradiated with 2 Gy before being collected at the indicated time points and assessed for comet tail migration in neutral conditions. Quantification of the neutral comet assay is represented as a box‐and‐whisker (10–90 percentile). At least 100 cells per condition were counted. Significance was determined by two‐way ANOVA followed by a Dunnett’s test. *P < 0.05, **P < 0.0001.
U2OS (left panel, n = 6 biological replicates) or HeLa cells (right panel, n = 3 biological replicates) were transfected with the indicated siRNA; 48 h post‐transfection, they were treated with the radiomimetic antibiotic, phleomycin (50 µg/ml) and collected at the indicated time points. Flow cytometry analysis of phosphorylated – H2AX signal was used to measure γ‐H2AX endogenous signal. Data are represented as a bar graph showing the mean ± SEM, each replicate being represented by a round symbol. Significance was determined by two‐way ANOVA followed by a Holm‐Sidak’s test. *P < 0.05, **P < 0.01, ***P < 0.0005.
U2OS (n = 8 biological replicates) were transfected with the indicated siRNA; 48 h post‐transfection, they were treated with the radiomimetic antibiotic, phleomycin (50 µg/ml), and collected at the indicated time points. Data are represented as a bar graph showing the mean ± SEM, each replicate being representing as a round symbol. Significance was determined by two‐way ANOVA followed by a Sidak’s test. *P < 0.05.

