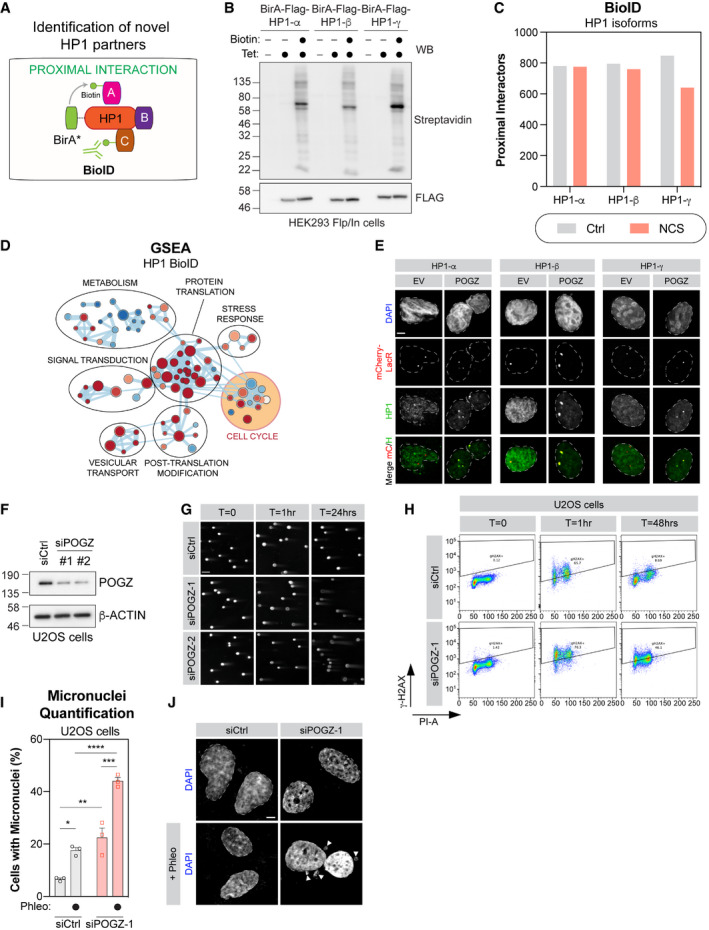
Figure EV1. Defining the proximal interactome of the different HP1 isoforms.

- Schematic diagram representing the BioID approach applied to HP1 and the mapping of its proximal interactome by biotinylation.
- HEK293 Flp‐In cells stably expressing each BirA*‐Flag‐HP1 isoform were tested for expression and biotinylation following induction with tetracycline and incubation with biotin as indicated. After induction, cells were lysed and subjected to immunoblot for Flag and Streptavidin.
- High‐confidence proximal interactors of the different HP1 isoforms identified by BioID, in presence (NCS) or absence of DNA damage (Ctrl) (n = 3 biological replicates).
- GSEA enrichment map of HP1‐isoform interactome identifying annotated Reactome pathways. Enrichment maps from GSEA were developed with a ranked interaction network (P < 0.2, FDR < 0.5 and overlap coefficient = 0.75). Individual pathways in “Cell Cycle”, highlighted in yellow, are further examined in Fig 1C.
- U2OS cells with a stable LacO sequence integration were transfected either with mCherry‐LacR (EV) or a mCherry‐LacR‐tagged version of POGZ (POGZ). Immunofluorescent labelling of endogenous HP1 isoforms colocalizing with the mCherry‐LacR signal were quantified and normalized to nuclear background fluorescence. Representative images of cells quantified in Fig 1E. Scale bar = 5 μm.
- U2OS cells treated with the indicated siRNA were lysed 48 h post‐transfected and processed for POGZ western blot. β‐actin was used a loading control.
- Representative images used for quantification plotted in Fig 1F. U2OS cells treated with the indicated siRNA were irradiated, 48 h post‐transfection, with 1 Gy and run in low melting agarose under neutral conditions. DNA was stained with SYBR Gold to measure the tail moment. Scale bar = 10 μm.
- Representative flow cytometry plots of g‐H2AX levels analysed in Fig 1G.
- U2OS cells were transfected with indicated siRNA were stained with DAPI to visualize micronuclei by confocal microscopy. Data are number of cells per field of view displaying a micronucleus and are represented as a bar graph showing the mean ± SEM (n = 3 biological replicates, with a minimum of three fields taken per replicate). Significance was determined by two‐way ANOVA followed by a Tukey’s test. *P < 0.05, **P < 0.005, ***P < 0.0005, ****P < 0.0001.
- Representative images used for quantification in (H). Scale bar is 10 μm.
Source data are available online for this figure.
