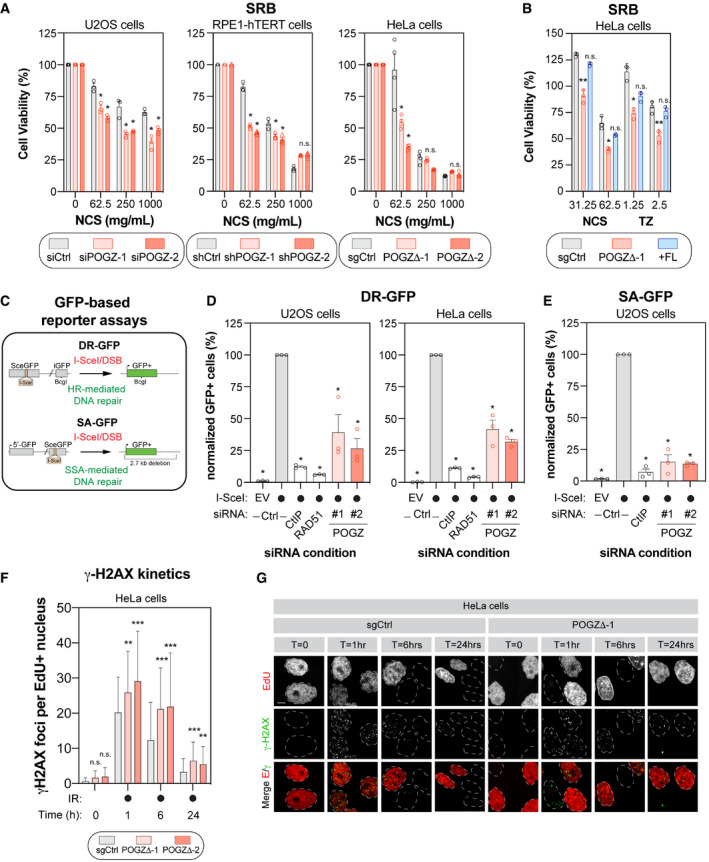
U2OS (left panel), RPE1‐hTERT (middle panel) and HeLa cells (right panel) were monitored for their sensitivity to the radiomimetic drug NCS using the SRB assay. For each cell line, the following conditions were used: U2OS cells were transfected with a non‐targeting siRNA (siCtrl) or an siRNA targeting human POGZ (siPOGZ‐1 or ‐2); RPE1‐hTERT cells were transduced a control shRNA (shCtrl) or a shRNA directed against human POGZ (shPOGZ‐1 or ‐2); HeLa cells expressing a non‐targeting sgRNA (sgCtrl) or a sgRNA targeting human POGZ and sub‐cloned (POGZΔ‐1 or ‐2). Cells were pulsed with NCS at the indicated concentrations for 1 h, replenished with fresh medium and incubated for 4 days before being processed for SRB assays. Data are represented as a bar graph showing the relative mean ± SEM, each replicate being representing as a round symbol (three biological replicates). Significance was determined by two‐way ANOVA followed by a Bonferroni’s test. *P < 0.01.
HeLa cells with (+FL, blue), or without full length POGZ‐cDNA supplementation (POGZΔ‐1, red), as well as control HeLa cells (sgCtrl, grey), were treated with NCS (1 h) or TZ (24 h) at the indicated concentrations and processed as in (A) for SRB assay. Data are represented as a bar graph showing the relative mean ± SEM, each replicate being representing as a round symbol (three biological replicates). Significance was determined by two‐way ANOVA followed by a Bonferroni’s test. *P < 0.05, **P < 0.005.
Schematic diagram of the DR‐GFP (top panel) and the SA‐GFP (bottom panel) assays.
U2OS (left panel) and HeLa (right panel) cells containing the DR‐GFP reporter construct were transfected with the indicated siRNA. Twenty‐four hours post‐transfection. Cells were transfected with the I‐SceI expression plasmid or an empty vector (EV), and the GFP+ population was analysed 48 h post‐plasmid transfection. The percentage of GFP+ cells was determined for each individual condition and subsequently normalized to the non‐targeting condition provided with I‐SceI (siCtrl, I‐SceI). Data are represented as the mean ± SEM, each replicate being representing as a round symbol (n = 3 biological replicates). Significance was determined by one‐way ANOVA followed by a Dunnett’s test. *P ≤ 0.0001.
U2OS cells containing the SA‐GFP reporter plasmid were processed and analysed as in (D). Data are represented as the mean ± SEM, each replicate being representing as a round symbol (n = 3 biological replicates). Significance was determined by one‐way ANOVA followed by a Dunnett’s test. *P ≤ 0.0001.
Quantification of γ‐H2AX foci in HeLa cells where POGZ has been targeted by CRISPR technology (POGZΔ‐1 or ‐2) and in control HeLa cells (sgCtrl). Cells were exposed to 1 Gy before being pulsed with Edu for 1 h and were recovered at the indicated time points. Cells were fixed, stained and imaged via confocal microscopy. Data are the total number of γ‐H2AX foci in EdU+ cells and represented as a bar graph showing the mean ± SD (n = 3 biological replicates, with at least 100 cells analysed for each time point). Significance was determined by two‐way ANOVA followed by a Dunnett’s test. *P < 0.05, **P < 0.0005.
Representative images used for quantification in (F). Scale bar = 5 µm.

